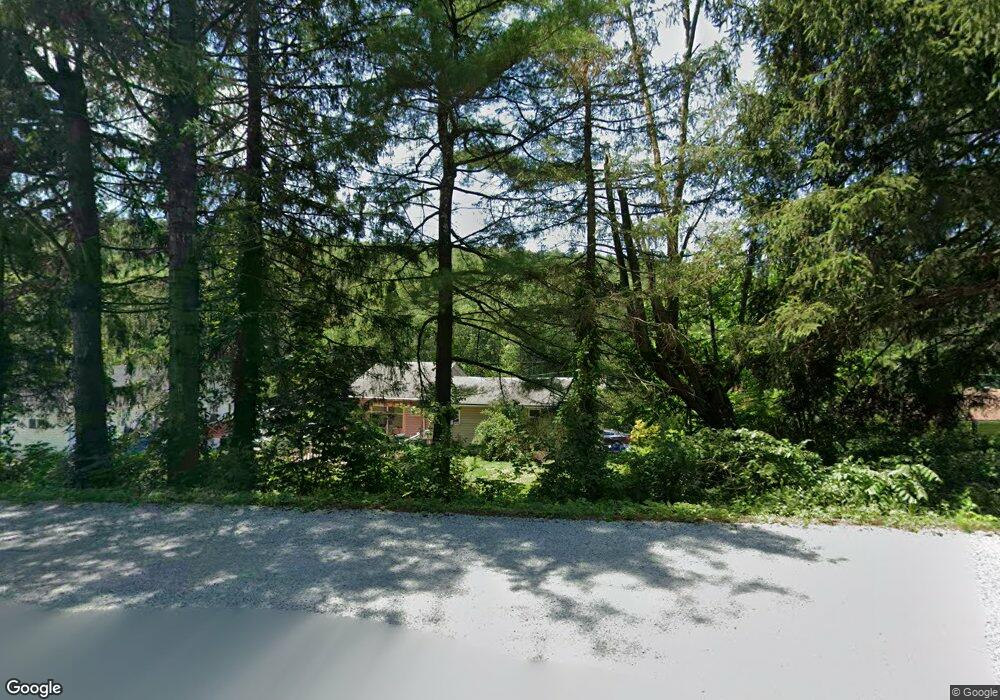
107 James Ln Kunkletown, PA 18058
Estimated Value: $221,000 - $277,000
3
Beds
2
Baths
1,198
Sq Ft
$206/Sq Ft
Est. Value
About This Home
This home is located at 107 James Ln, Kunkletown, PA 18058 and is currently estimated at $246,840, approximately $206 per square foot. 107 James Ln is a home located in Monroe County with nearby schools including Pleasant Valley Elementary School, Pleasant Valley Intermediate School, and Pleasant Valley Middle School.
Ownership History
Date
Name
Owned For
Owner Type
Purchase Details
Closed on
Aug 24, 2010
Sold by
Ring Katelynn M and Anthony Derek J
Bought by
Qureshi Mohamed S
Current Estimated Value
Home Financials for this Owner
Home Financials are based on the most recent Mortgage that was taken out on this home.
Original Mortgage
$108,439
Outstanding Balance
$75,084
Interest Rate
5.5%
Mortgage Type
FHA
Estimated Equity
$171,756
Purchase Details
Closed on
Mar 15, 2010
Sold by
Us Bank National Association
Bought by
Ring Katelynn M and Anthony Derek J
Purchase Details
Closed on
Oct 26, 2009
Sold by
Barth Christopher A and Barth Christine
Bought by
Us Bank National Association
Create a Home Valuation Report for This Property
The Home Valuation Report is an in-depth analysis detailing your home's value as well as a comparison with similar homes in the area
Home Values in the Area
Average Home Value in this Area
Purchase History
| Date | Buyer | Sale Price | Title Company |
|---|---|---|---|
| Qureshi Mohamed S | $109,900 | None Available | |
| Ring Katelynn M | $32,000 | None Available | |
| Us Bank National Association | $3,088 | None Available |
Source: Public Records
Mortgage History
| Date | Status | Borrower | Loan Amount |
|---|---|---|---|
| Open | Qureshi Mohamed S | $108,439 |
Source: Public Records
Tax History Compared to Growth
Tax History
| Year | Tax Paid | Tax Assessment Tax Assessment Total Assessment is a certain percentage of the fair market value that is determined by local assessors to be the total taxable value of land and additions on the property. | Land | Improvement |
|---|---|---|---|---|
| 2025 | $928 | $120,810 | $21,930 | $98,880 |
| 2024 | $746 | $120,810 | $21,930 | $98,880 |
| 2023 | $3,632 | $120,810 | $21,930 | $98,880 |
| 2022 | $3,502 | $120,810 | $21,930 | $98,880 |
| 2021 | $3,426 | $120,810 | $21,930 | $98,880 |
| 2020 | $625 | $120,810 | $21,930 | $98,880 |
| 2019 | $2,181 | $12,080 | $1,250 | $10,830 |
| 2018 | $2,157 | $12,080 | $1,250 | $10,830 |
| 2017 | $2,157 | $12,080 | $1,250 | $10,830 |
| 2016 | $371 | $12,080 | $1,250 | $10,830 |
| 2015 | -- | $12,080 | $1,250 | $10,830 |
| 2014 | -- | $12,080 | $1,250 | $10,830 |
Source: Public Records
Map
Nearby Homes
- 1182 Quail Rd
- 131 Lobach Ln
- Lot 38 Woodview Hills
- 295 Railbed Trail
- 2650 57 Rd
- 5990 Little Gap Rd
- 142 Pine Grove Rd
- 150 Red Oak Dr
- CO Line Forest Dr
- Lot 32 Greenview Ct
- 120 Upper Greenhill Rd
- 969 Hideaway Hill Rd
- 5138 Walnut St
- 209 Floyd Dr
- 60 Ginkgo Rd
- 157 Viewtop Rd
- 0 Sr 209 Unit PM-130225
- 4400 Little Gap Rd
- 1101 Red Fox Ct Unit Ct 9
- 0 Log Fence Rd Unit PACC2006852