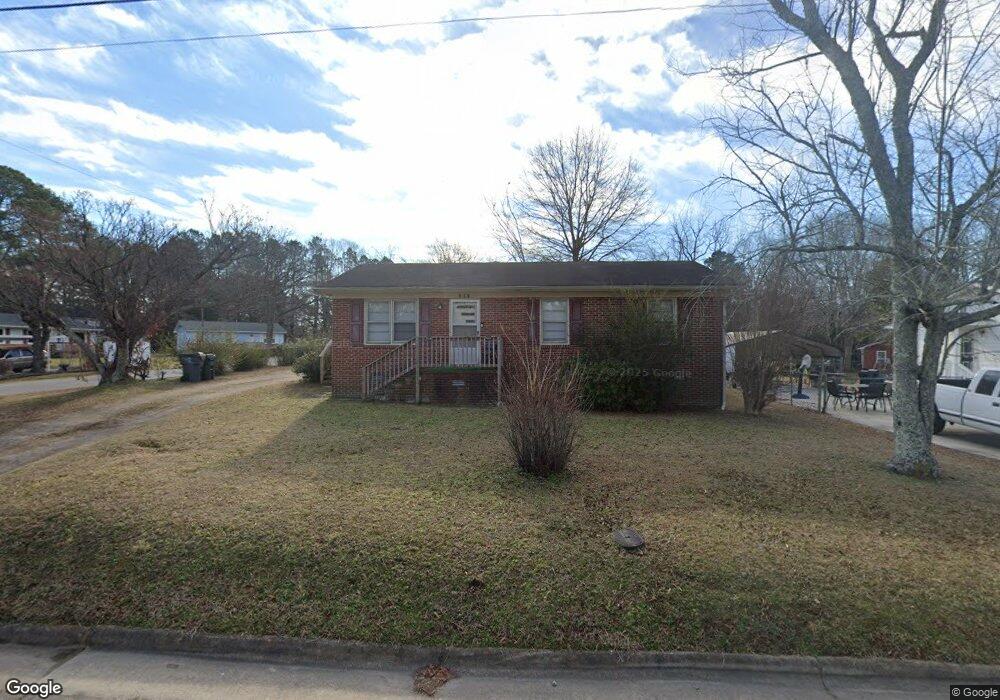
107 Leak Ave Oxford, NC 27565
Estimated Value: $150,000 - $162,000
3
Beds
1
Bath
960
Sq Ft
$163/Sq Ft
Est. Value
About This Home
This home is located at 107 Leak Ave, Oxford, NC 27565 and is currently estimated at $156,348, approximately $162 per square foot. 107 Leak Ave is a home located in Granville County with nearby schools including Stovall-Shaw Elementary School, Northern Granville Middle School, and Hill City High School.
Ownership History
Date
Name
Owned For
Owner Type
Purchase Details
Closed on
Feb 13, 2020
Sold by
Keplar Kenneth W
Bought by
Cub Creek Properties Llc
Current Estimated Value
Home Financials for this Owner
Home Financials are based on the most recent Mortgage that was taken out on this home.
Original Mortgage
$68,000
Outstanding Balance
$60,209
Interest Rate
3.6%
Mortgage Type
Future Advance Clause Open End Mortgage
Estimated Equity
$96,139
Purchase Details
Closed on
Sep 12, 2016
Sold by
Bass Carrie Louise Hester and Thornton Wilhelmenia Bass
Bought by
Keplar Kenneth Wyley
Purchase Details
Closed on
Jun 10, 2008
Sold by
Thornton Wilhelmenia Bass
Bought by
Hester Charles and Bass Louise
Purchase Details
Closed on
May 21, 2008
Sold by
Pridgen Rhomeyn L
Bought by
Thornton Wilhelmenia Bass
Purchase Details
Closed on
Oct 15, 1990
Bought by
Hester Charles
Create a Home Valuation Report for This Property
The Home Valuation Report is an in-depth analysis detailing your home's value as well as a comparison with similar homes in the area
Home Values in the Area
Average Home Value in this Area
Purchase History
| Date | Buyer | Sale Price | Title Company |
|---|---|---|---|
| Cub Creek Properties Llc | $85,000 | None Available | |
| Keplar Kenneth Wyley | $47,000 | None Available | |
| Hester Charles | -- | -- | |
| Thornton Wilhelmenia Bass | $15,000 | -- | |
| Hester Charles | -- | -- |
Source: Public Records
Mortgage History
| Date | Status | Borrower | Loan Amount |
|---|---|---|---|
| Open | Cub Creek Properties Llc | $68,000 |
Source: Public Records
Tax History Compared to Growth
Tax History
| Year | Tax Paid | Tax Assessment Tax Assessment Total Assessment is a certain percentage of the fair market value that is determined by local assessors to be the total taxable value of land and additions on the property. | Land | Improvement |
|---|---|---|---|---|
| 2025 | $1,054 | $87,394 | $18,000 | $69,394 |
| 2024 | $1,054 | $87,394 | $18,000 | $69,394 |
| 2023 | $1,052 | $54,100 | $13,500 | $40,600 |
| 2022 | $892 | $54,100 | $13,500 | $40,600 |
| 2021 | $801 | $54,100 | $13,500 | $40,600 |
| 2020 | $801 | $54,100 | $13,500 | $40,600 |
| 2019 | $801 | $54,100 | $13,500 | $40,600 |
| 2018 | $801 | $54,100 | $13,500 | $40,600 |
| 2016 | $427 | $56,171 | $13,500 | $42,671 |
| 2015 | $413 | $56,171 | $13,500 | $42,671 |
| 2014 | $413 | $56,171 | $13,500 | $42,671 |
| 2013 | -- | $56,171 | $13,500 | $42,671 |
Source: Public Records
Map
Nearby Homes
- 617 Raleigh St
- 608 Raleigh St
- 211 Wilmington Ave
- 106 Summitt Ave
- 501 Raleigh St
- 504 Henderson St
- 412 Coggeshall St
- 412 Kingsbury St
- 421 Granville St
- 221 Gilliam St
- 112 1st St
- 206 1st St
- 102 Royall Rd
- 505 Forest Rd
- 230 Maple Dr Unit 232
- 405 Sycamore St
- 103 W Spring St
- 105 W Spring St
- 220 Maple Dr Unit A & B
- 104 Parker St