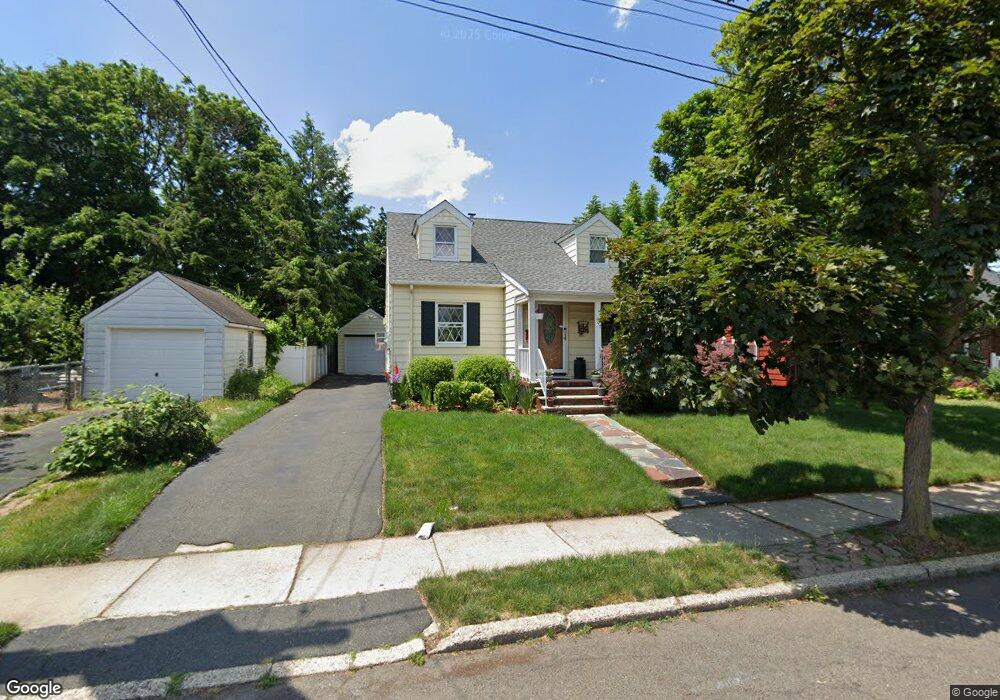
107 Linden St Carteret, NJ 07008
Estimated Value: $470,340 - $530,000
--
Bed
--
Bath
1,501
Sq Ft
$336/Sq Ft
Est. Value
About This Home
This home is located at 107 Linden St, Carteret, NJ 07008 and is currently estimated at $504,335, approximately $335 per square foot. 107 Linden St is a home located in Middlesex County with nearby schools including Carteret High School and St Joseph School.
Ownership History
Date
Name
Owned For
Owner Type
Purchase Details
Closed on
Mar 5, 2008
Sold by
Miller Melbourne
Bought by
Jeffers Yvonne
Current Estimated Value
Home Financials for this Owner
Home Financials are based on the most recent Mortgage that was taken out on this home.
Original Mortgage
$230,000
Outstanding Balance
$143,363
Interest Rate
5.75%
Mortgage Type
New Conventional
Estimated Equity
$360,972
Purchase Details
Closed on
Jul 27, 1998
Sold by
Richter Kenneth
Bought by
Jeffers Yvonne and Miller Melbourne
Home Financials for this Owner
Home Financials are based on the most recent Mortgage that was taken out on this home.
Original Mortgage
$130,500
Interest Rate
6.92%
Create a Home Valuation Report for This Property
The Home Valuation Report is an in-depth analysis detailing your home's value as well as a comparison with similar homes in the area
Home Values in the Area
Average Home Value in this Area
Purchase History
| Date | Buyer | Sale Price | Title Company |
|---|---|---|---|
| Jeffers Yvonne | $47,500 | -- | |
| Jeffers Yvonne | $145,000 | -- |
Source: Public Records
Mortgage History
| Date | Status | Borrower | Loan Amount |
|---|---|---|---|
| Open | Jeffers Yvonne | $230,000 | |
| Previous Owner | Jeffers Yvonne | $130,500 |
Source: Public Records
Tax History Compared to Growth
Tax History
| Year | Tax Paid | Tax Assessment Tax Assessment Total Assessment is a certain percentage of the fair market value that is determined by local assessors to be the total taxable value of land and additions on the property. | Land | Improvement |
|---|---|---|---|---|
| 2025 | $6,535 | $483,900 | $330,000 | $153,900 |
| 2024 | $6,367 | $205,000 | $80,000 | $125,000 |
| 2023 | $6,367 | $205,000 | $80,000 | $125,000 |
| 2022 | $6,191 | $205,000 | $80,000 | $125,000 |
| 2021 | $4,537 | $205,000 | $80,000 | $125,000 |
| 2020 | $5,896 | $205,000 | $80,000 | $125,000 |
| 2019 | $5,726 | $205,000 | $80,000 | $125,000 |
| 2018 | $5,590 | $205,000 | $80,000 | $125,000 |
| 2017 | $5,392 | $205,000 | $80,000 | $125,000 |
| 2016 | $6,130 | $189,900 | $70,000 | $119,900 |
| 2015 | $5,927 | $189,900 | $70,000 | $119,900 |
| 2014 | $5,669 | $189,900 | $70,000 | $119,900 |
Source: Public Records
Map
Nearby Homes