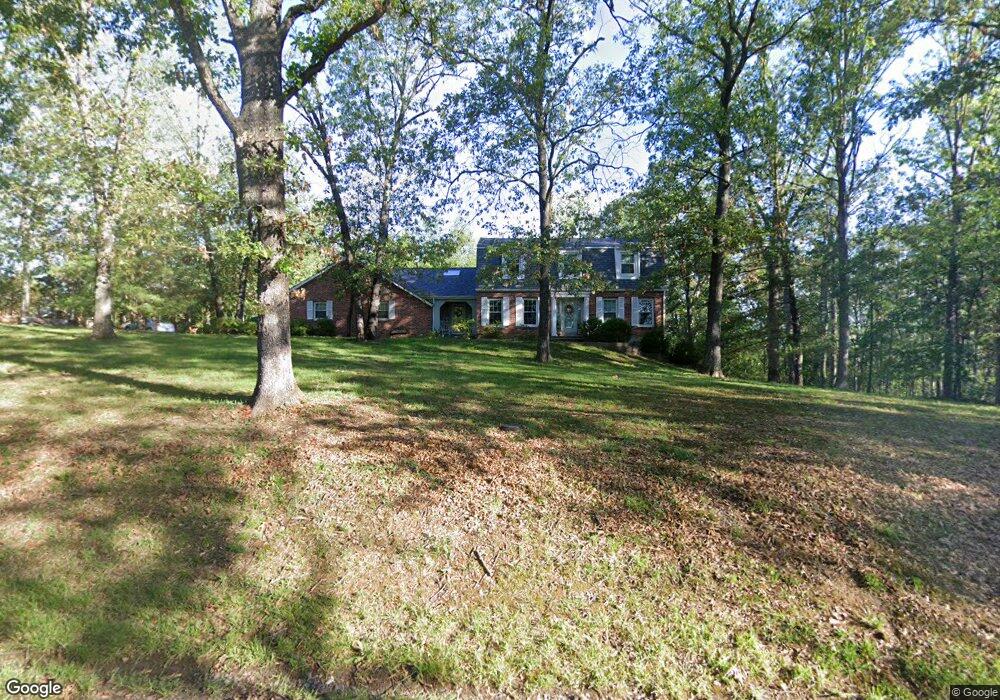
107 Monticello Trace Festus, MO 63028
Estimated Value: $476,778 - $651,000
4
Beds
4
Baths
2,460
Sq Ft
$229/Sq Ft
Est. Value
About This Home
This home is located at 107 Monticello Trace, Festus, MO 63028 and is currently estimated at $563,889, approximately $229 per square foot. 107 Monticello Trace is a home located in Jefferson County with nearby schools including Festus Elementary School, Festus Intermediate School, and Festus Middle School.
Ownership History
Date
Name
Owned For
Owner Type
Purchase Details
Closed on
May 29, 2012
Sold by
Perry Mark A and Perry Jane F
Bought by
Kearns Merlin S and Kearns Michele R
Current Estimated Value
Home Financials for this Owner
Home Financials are based on the most recent Mortgage that was taken out on this home.
Original Mortgage
$241,300
Outstanding Balance
$167,420
Interest Rate
3.93%
Mortgage Type
New Conventional
Estimated Equity
$396,469
Purchase Details
Closed on
Mar 22, 2002
Sold by
Perry Mark A and Perry Jane F
Bought by
Perry Laura Michelle
Home Financials for this Owner
Home Financials are based on the most recent Mortgage that was taken out on this home.
Original Mortgage
$191,120
Interest Rate
6.83%
Purchase Details
Closed on
Mar 14, 2001
Sold by
Kottmeier Christine M
Bought by
Christine M Kottmeier Revocable Trust
Create a Home Valuation Report for This Property
The Home Valuation Report is an in-depth analysis detailing your home's value as well as a comparison with similar homes in the area
Purchase History
| Date | Buyer | Sale Price | Title Company |
|---|---|---|---|
| Kearns Merlin S | -- | Ust | |
| Perry Laura Michelle | -- | Capital Title | |
| Perry Mark A | -- | Capital Title | |
| Christine M Kottmeier Revocable Trust | -- | -- |
Source: Public Records
Mortgage History
| Date | Status | Borrower | Loan Amount |
|---|---|---|---|
| Open | Kearns Merlin S | $241,300 | |
| Previous Owner | Perry Mark A | $191,120 | |
| Closed | Perry Mark A | $23,890 |
Source: Public Records
Tax History
| Year | Tax Paid | Tax Assessment Tax Assessment Total Assessment is a certain percentage of the fair market value that is determined by local assessors to be the total taxable value of land and additions on the property. | Land | Improvement |
|---|---|---|---|---|
| 2025 | $2,683 | $55,900 | $5,700 | $50,200 |
| 2024 | $2,683 | $49,900 | $4,500 | $45,400 |
| 2023 | $2,683 | $49,900 | $4,500 | $45,400 |
| 2022 | $2,669 | $49,900 | $4,500 | $45,400 |
| 2021 | $2,671 | $49,900 | $4,500 | $45,400 |
| 2020 | $2,591 | $45,400 | $4,100 | $41,300 |
| 2019 | $2,590 | $45,400 | $4,100 | $41,300 |
| 2018 | $2,318 | $45,400 | $4,100 | $41,300 |
| 2016 | $1,963 | $41,200 | $4,100 | $37,100 |
Source: Public Records
Map
Nearby Homes
- 131 Blue Ridge Trace
- 2310 Peterein Ct
- 0 Hwy A 62 Acres Unit 20012897
- 0 Bailey School Rd
- 1829 Belmont Ct
- 1816 Belmont Ct
- 0
- 0 Tbb Birchwood Overlook-Dogwood Unit MAR24022693
- 0 Tbb Birchwood Overlook - Maple
- 610 Edgewood Ln
- 2441 French Dr
- 2421 French Dr
- 1512 Louisiana Dr
- 1868 Sunset Ridge
- 2420 French Dr
- 0 Tbb Birchwood Overlook Birchwo Unit MAR24022701
- 1102 Stone Henge Ct
- 530 Cedar Ln
- 0 Tbb Birchwood Overlook-Red Bud Unit MAR24022708
- TBD Cedar Ln
- 108 Monticello Trace
- 2660 Ridgeview Acres Dr
- 106 Monticello Trace
- 2642 Ridgeview Acres Dr
- 10272 Huntington Ridge
- 110 Monticello Trace
- 2634 Ridgeview Acres Dr
- 104 Monticello Trace
- 10266 Huntington Ridge
- 2671 Ridgeview Acres Dr
- 2672 Ridgeview Acres Dr
- 2626 Ridgeview Acres Dr
- 2680 Ridgeview Acres Dr
- 10254 Huntington Ridge
- 10236 Huntington Ridge
- 2618 Ridgeview Acres Dr
- 2687 Ridgeview Acres Dr
- 2724 Ridgeview Acres Dr
- 102 Monticello Trace
- 2700 Ridgeview Acres Dr
Your Personal Tour Guide
Ask me questions while you tour the home.