Estimated Value: $584,000 - $599,000
4
Beds
3
Baths
2,604
Sq Ft
$227/Sq Ft
Est. Value
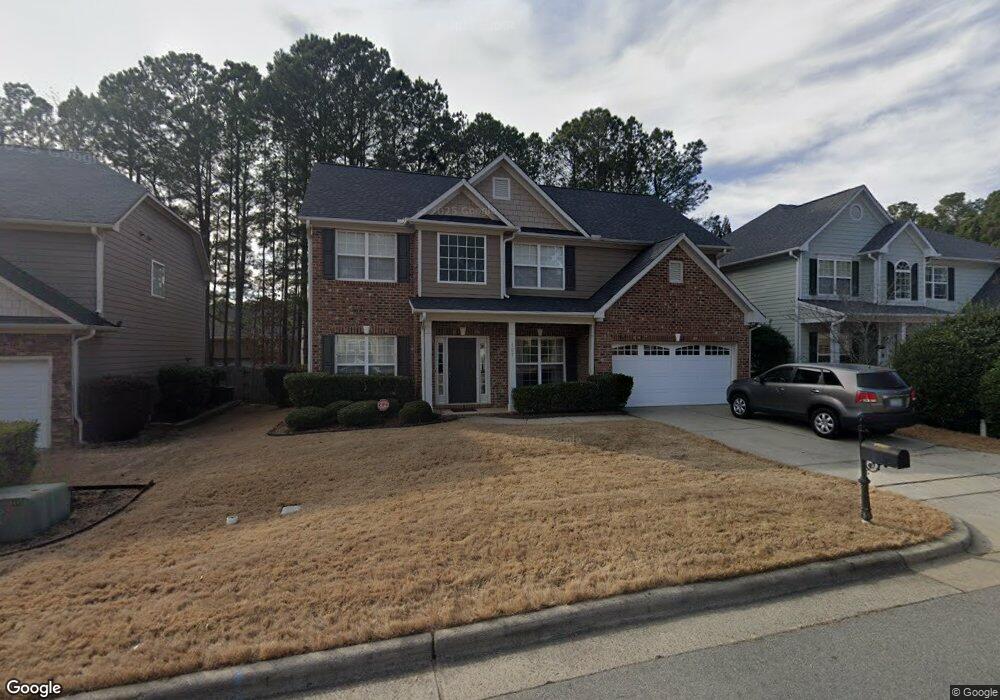
About This Home
This home is located at 107 Moss Mountain Ln, Apex, NC 27539 and is currently estimated at $590,016, approximately $226 per square foot. 107 Moss Mountain Ln is a home located in Wake County with nearby schools including Lufkin Road Middle School, Apex Friendship High School, and Pine Springs Prep Academy.
Ownership History
Date
Name
Owned For
Owner Type
Purchase Details
Closed on
Dec 11, 2020
Sold by
Maltais Thomas E and Maltais Nancy A
Bought by
Maltais Thomas E and Maltais Nancy A
Current Estimated Value
Purchase Details
Closed on
Oct 29, 2015
Sold by
Adkins Norman L and Adkins Morgan E
Bought by
Maltais Thomas E and Maltais Nancy A
Home Financials for this Owner
Home Financials are based on the most recent Mortgage that was taken out on this home.
Original Mortgage
$315,581
Outstanding Balance
$249,394
Interest Rate
3.93%
Mortgage Type
VA
Estimated Equity
$340,622
Purchase Details
Closed on
Feb 23, 2007
Sold by
Mccar Homes Raleigh Llc
Bought by
Adkins Norman L and Adkins Morgan E
Home Financials for this Owner
Home Financials are based on the most recent Mortgage that was taken out on this home.
Original Mortgage
$233,500
Interest Rate
6.17%
Mortgage Type
Purchase Money Mortgage
Create a Home Valuation Report for This Property
The Home Valuation Report is an in-depth analysis detailing your home's value as well as a comparison with similar homes in the area
Home Values in the Area
Average Home Value in this Area
Purchase History
| Date | Buyer | Sale Price | Title Company |
|---|---|---|---|
| Maltais Thomas E | -- | None Available | |
| Maltais Thomas E | $305,500 | Attorney | |
| Adkins Norman L | $293,000 | None Available |
Source: Public Records
Mortgage History
| Date | Status | Borrower | Loan Amount |
|---|---|---|---|
| Open | Maltais Thomas E | $315,581 | |
| Previous Owner | Adkins Norman L | $233,500 | |
| Previous Owner | Adkins Norman L | $17,500 |
Source: Public Records
Tax History Compared to Growth
Tax History
| Year | Tax Paid | Tax Assessment Tax Assessment Total Assessment is a certain percentage of the fair market value that is determined by local assessors to be the total taxable value of land and additions on the property. | Land | Improvement |
|---|---|---|---|---|
| 2025 | $4,454 | $507,796 | $130,000 | $377,796 |
| 2024 | $4,354 | $507,796 | $130,000 | $377,796 |
| 2023 | $4,005 | $363,239 | $70,000 | $293,239 |
| 2022 | $3,760 | $363,239 | $70,000 | $293,239 |
| 2021 | $3,616 | $363,239 | $70,000 | $293,239 |
| 2020 | $3,580 | $363,239 | $70,000 | $293,239 |
| 2019 | $3,223 | $282,002 | $54,000 | $228,002 |
| 2018 | $3,036 | $282,002 | $54,000 | $228,002 |
| 2017 | $2,826 | $282,002 | $54,000 | $228,002 |
| 2016 | $2,785 | $282,002 | $54,000 | $228,002 |
| 2015 | $2,842 | $280,915 | $54,000 | $226,915 |
| 2014 | $2,739 | $280,915 | $54,000 | $226,915 |
Source: Public Records
Map
Nearby Homes
- 746 Wickham Ridge Rd
- 680 Wickham Ridge Rd
- 102 Gallent Hedge Trail
- 3325 Colby Chase Dr Unit Lot 9
- 3340 Colby Chase Dr Unit Lot 2
- 102 Spring Dove Ln
- 2340 Horton Park Dr
- 2273 Horton Park Dr
- 2271 Horton Park Dr
- 5828 Old Smithfield Rd
- 2269 Horton Park Dr
- 2267 Horton Park Dr
- 2265 Horton Park Dr
- 2329 Horton Park Dr
- 2325 Horton Park Dr
- 2328 Horton Park Dr
- 2332 Horton Park Dr
- 2324 Horton Park Dr
- 2341 Horton Park Dr
- 2259 Horton Park Dr
- 105 Moss Mountain Ln
- 109 Moss Mountain Ln
- 106 Trackmire Ln
- 106 Trackimire Ln
- 103 Moss Mountain Ln
- 104 Trackimire Ln
- 104 Trackmire Ln
- 108 Trackmire Ln
- 108 Trackimire Ln
- 202 Trackmire Ln
- 106 Moss Mountain Ln
- 102 Trackmire Ln
- 104 Moss Mountain Ln
- 108 Moss Mountain Ln
- 101 Moss Mountain Ln
- 102 Moss Mountain Ln
- 305 October Glory Ln
- 307 October Glory Ln
- 100 Trackmire Ln
- 303 October Glory Ln