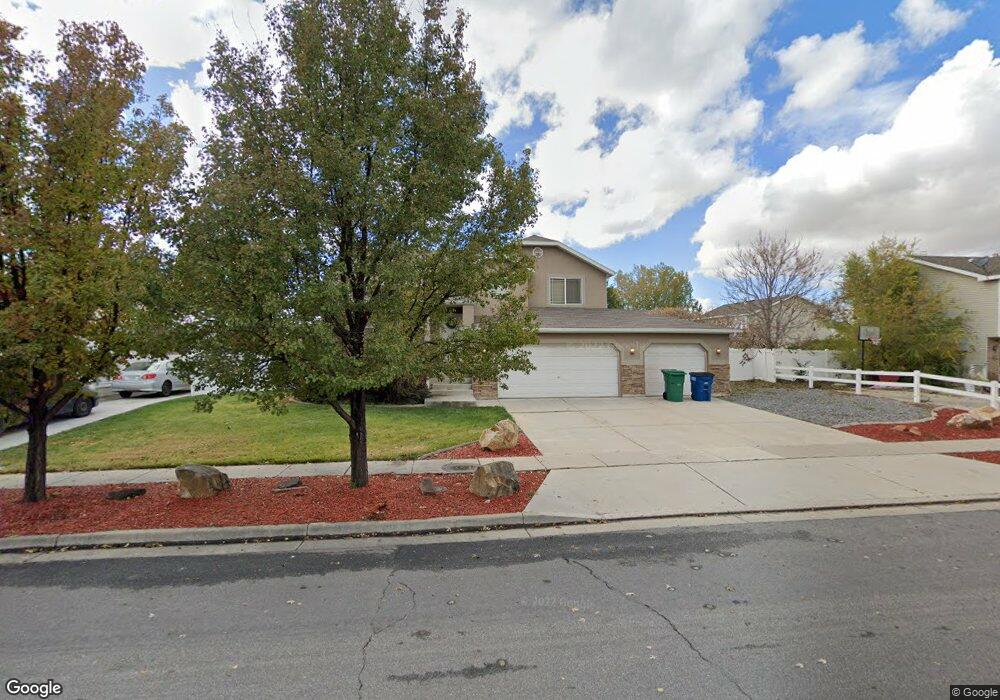
107 N 875 W Layton, UT 84041
Estimated Value: $509,000 - $568,000
4
Beds
2
Baths
2,401
Sq Ft
$224/Sq Ft
Est. Value
About This Home
This home is located at 107 N 875 W, Layton, UT 84041 and is currently estimated at $538,114, approximately $224 per square foot. 107 N 875 W is a home located in Davis County with nearby schools including Layton Elementary School, Fairfield Junior High School, and Layton High School.
Ownership History
Date
Name
Owned For
Owner Type
Purchase Details
Closed on
Mar 27, 2012
Sold by
Jensen Ethan
Bought by
Jensen Ethan and Jensen Elena
Current Estimated Value
Home Financials for this Owner
Home Financials are based on the most recent Mortgage that was taken out on this home.
Original Mortgage
$203,300
Outstanding Balance
$139,586
Interest Rate
3.86%
Mortgage Type
New Conventional
Estimated Equity
$398,528
Purchase Details
Closed on
Jan 9, 2003
Sold by
Celebrity Builders Inc
Bought by
Chavez Brandon D and Chavez Brady
Home Financials for this Owner
Home Financials are based on the most recent Mortgage that was taken out on this home.
Original Mortgage
$152,334
Interest Rate
6.06%
Mortgage Type
FHA
Create a Home Valuation Report for This Property
The Home Valuation Report is an in-depth analysis detailing your home's value as well as a comparison with similar homes in the area
Home Values in the Area
Average Home Value in this Area
Purchase History
| Date | Buyer | Sale Price | Title Company |
|---|---|---|---|
| Jensen Ethan | -- | First American Title | |
| Jensen Ethan | -- | First American Title | |
| Chavez Brandon D | -- | Guardian Title Company | |
| Celebrity Builders Inc | -- | Guardian Title Company |
Source: Public Records
Mortgage History
| Date | Status | Borrower | Loan Amount |
|---|---|---|---|
| Open | Jensen Ethan | $203,300 | |
| Previous Owner | Chavez Brandon D | $152,334 |
Source: Public Records
Tax History
| Year | Tax Paid | Tax Assessment Tax Assessment Total Assessment is a certain percentage of the fair market value that is determined by local assessors to be the total taxable value of land and additions on the property. | Land | Improvement |
|---|---|---|---|---|
| 2025 | $2,573 | $270,050 | $108,938 | $161,112 |
| 2024 | $2,491 | $263,450 | $120,912 | $142,538 |
| 2023 | $2,388 | $445,000 | $118,831 | $326,169 |
| 2022 | $2,739 | $277,200 | $74,862 | $202,338 |
| 2021 | $2,411 | $364,000 | $112,323 | $251,677 |
| 2020 | $2,182 | $316,000 | $94,322 | $221,678 |
| 2019 | $2,136 | $303,000 | $97,366 | $205,634 |
| 2018 | $1,903 | $271,000 | $85,331 | $185,669 |
| 2016 | $1,645 | $120,836 | $33,226 | $87,610 |
| 2015 | $1,603 | $111,761 | $33,226 | $78,535 |
| 2014 | $1,593 | $113,589 | $33,226 | $80,363 |
| 2013 | -- | $100,733 | $28,952 | $71,781 |
Source: Public Records
Map
Nearby Homes
Your Personal Tour Guide
Ask me questions while you tour the home.