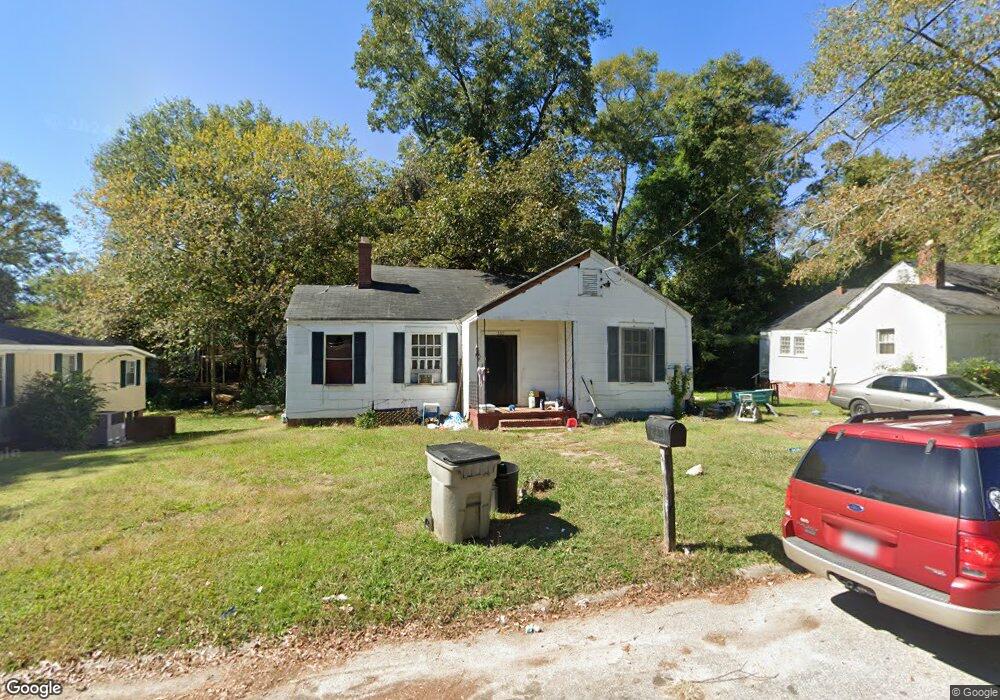
107 N Dawson St Lagrange, GA 30241
Estimated Value: $61,000 - $86,000
3
Beds
1
Bath
1,116
Sq Ft
$64/Sq Ft
Est. Value
About This Home
This home is located at 107 N Dawson St, Lagrange, GA 30241 and is currently estimated at $70,877, approximately $63 per square foot. 107 N Dawson St is a home located in Troup County with nearby schools including Hollis Hand Elementary School, Franklin Forest Elementary School, and Ethel W. Kight Elementary School.
Ownership History
Date
Name
Owned For
Owner Type
Purchase Details
Closed on
Nov 29, 2023
Sold by
Keith Jimmy
Bought by
Roldan David M
Current Estimated Value
Purchase Details
Closed on
Aug 27, 1997
Sold by
Jimmy Keith Int
Bought by
Keith Jimmy and Keith Carol
Purchase Details
Closed on
Aug 26, 1997
Sold by
Gouchenhour D
Bought by
Jimmy Keith Int
Purchase Details
Closed on
Jan 30, 1997
Sold by
Deborah Bowen
Bought by
Gouchenhour D
Purchase Details
Closed on
Aug 1, 1996
Sold by
Martha Ann Bowen By Ex
Bought by
Deborah Bowen
Purchase Details
Closed on
Aug 8, 1986
Sold by
Martha Ann Bowen
Bought by
Martha Ann Bowen By Ex
Purchase Details
Closed on
Feb 15, 1983
Sold by
Otis Sanford Johnston
Bought by
Martha Ann Bowen
Purchase Details
Closed on
Feb 14, 1983
Sold by
Mattie Grace Johnston
Bought by
Otis Sanford Johnston
Purchase Details
Closed on
Jun 1, 1939
Bought by
Mattie Grace Johnston
Create a Home Valuation Report for This Property
The Home Valuation Report is an in-depth analysis detailing your home's value as well as a comparison with similar homes in the area
Home Values in the Area
Average Home Value in this Area
Purchase History
| Date | Buyer | Sale Price | Title Company |
|---|---|---|---|
| Roldan David M | $46,000 | -- | |
| Keith Jimmy | -- | -- | |
| Jimmy Keith Int | $34,000 | -- | |
| Gouchenhour D | $30,000 | -- | |
| Deborah Bowen | -- | -- | |
| Martha Ann Bowen By Ex | $32,000 | -- | |
| Martha Ann Bowen | -- | -- | |
| Otis Sanford Johnston | -- | -- | |
| Mattie Grace Johnston | -- | -- |
Source: Public Records
Tax History Compared to Growth
Tax History
| Year | Tax Paid | Tax Assessment Tax Assessment Total Assessment is a certain percentage of the fair market value that is determined by local assessors to be the total taxable value of land and additions on the property. | Land | Improvement |
|---|---|---|---|---|
| 2024 | $502 | $19,280 | $3,000 | $16,280 |
| 2023 | $467 | $17,120 | $3,000 | $14,120 |
| 2022 | $454 | $16,280 | $3,000 | $13,280 |
| 2021 | $448 | $14,840 | $3,000 | $11,840 |
| 2020 | $448 | $14,840 | $3,000 | $11,840 |
| 2019 | $355 | $11,760 | $3,600 | $8,160 |
| 2018 | $355 | $11,760 | $3,600 | $8,160 |
| 2017 | $355 | $11,760 | $3,600 | $8,160 |
| 2016 | $353 | $11,711 | $3,600 | $8,111 |
| 2015 | $356 | $11,796 | $3,038 | $8,758 |
| 2014 | $343 | $11,335 | $3,038 | $8,296 |
| 2013 | -- | $12,047 | $3,038 | $9,009 |
Source: Public Records
Map
Nearby Homes
- 519 Greenville St
- 803 1/2 Hines St
- 910 N 916 1000 1002 N Oak & 1011 1019 1021 Johnson St
- 801 Hines St
- 101 McGee St
- 600,606,608,616 S Harlem
- 621 Arthur St
- 121 de Groat St
- 208 Render St
- 131 Foch St
- 301 E Bacon St
- 600 S Harlem Cir
- 606 S Harlem Cir
- LOT 58 Belk St
- 119 Belk St
- LOT 65 Belk St
- LOT 66 Belk St
- 608 S Harlem Cir
- 0 Locust St
- 616 S Harlem Cir
- 105 N Dawson St
- 108 N Dawson St
- 100 Daugherty St
- 109 N Dawson St
- 98 Doughtery St
- 413 Greenville St
- 106 Dougherty St Unit 8
- 501 Greenville St
- 411 Greenville St
- 201 N Dawson St
- 507 Greenville St
- 203 N Dawson St
- 100 Doughtery St
- 110 Doughtery St
- 114 Doughtery St
- 112 Doughtery St
- N N Dawson St
- 509 Greenville St
- 407 Greenville St
- 205 N Dawson St