V
Seller's Agent in 2024
Vision Realty Group
Laer Realty
(617) 721-0013
213 Total Sales
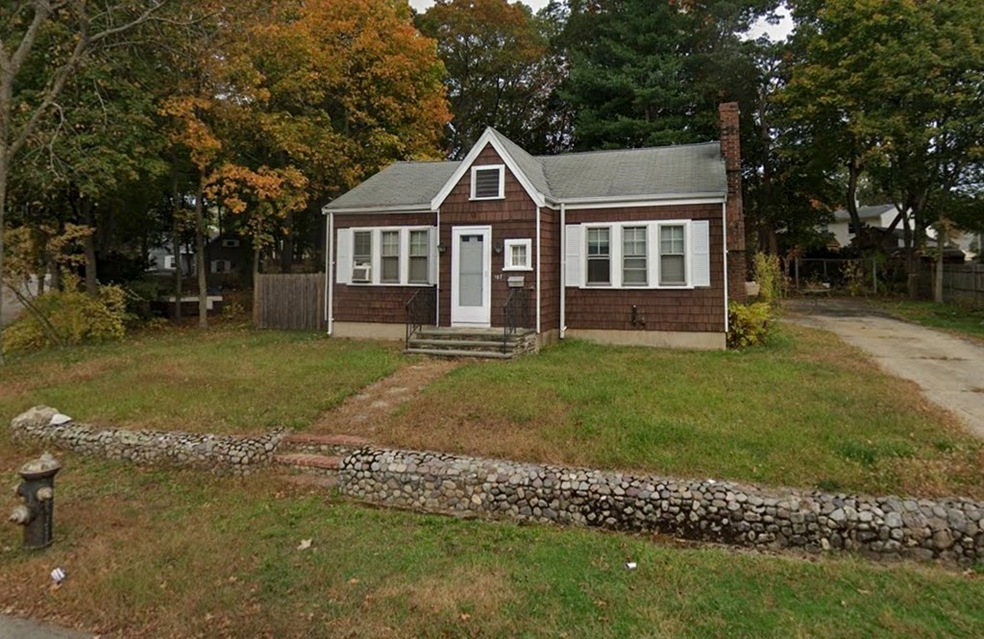
This home is located at 107 N Leyden St, Brockton, MA 02302 and is currently priced at $340,000, approximately $410 per square foot. This property was built in 1932. 107 N Leyden St is a home located in Plymouth County with nearby schools including Gilmore Elementary School, Davis K-8 School, and John F. Kennedy Elementary School.
| Date | Event | Price | Change | Sq Ft Price |
|---|---|---|---|---|
| 04/12/2024 04/12/24 | Sold | $340,000 | +4.9% | $411 / Sq Ft |
| 12/27/2023 12/27/23 | Pending | -- | -- | -- |
| 12/20/2023 12/20/23 | Price Changed | $324,000 | -7.2% | $391 / Sq Ft |
| 12/13/2023 12/13/23 | Price Changed | $349,000 | -6.9% | $421 / Sq Ft |
| 12/04/2023 12/04/23 | For Sale | $375,000 | +150.0% | $453 / Sq Ft |
| 07/19/2013 07/19/13 | Sold | $150,000 | -5.1% | $181 / Sq Ft |
| 06/03/2013 06/03/13 | Pending | -- | -- | -- |
| 05/21/2013 05/21/13 | Price Changed | $158,000 | -6.2% | $191 / Sq Ft |
| 10/24/2012 10/24/12 | Price Changed | $168,500 | -3.7% | $204 / Sq Ft |
| 09/13/2012 09/13/12 | For Sale | $175,000 | -- | $211 / Sq Ft |
| Year | Tax Paid | Tax Assessment Tax Assessment Total Assessment is a certain percentage of the fair market value that is determined by local assessors to be the total taxable value of land and additions on the property. | Land | Improvement |
|---|---|---|---|---|
| 2025 | $4,547 | $375,500 | $175,300 | $200,200 |
| 2024 | $4,461 | $371,100 | $175,300 | $195,800 |
| 2023 | $4,108 | $316,500 | $127,700 | $188,800 |
| 2022 | $3,856 | $276,000 | $116,100 | $159,900 |
| 2021 | $3,551 | $244,900 | $104,200 | $140,700 |
| 2020 | $3,324 | $219,400 | $90,800 | $128,600 |
| 2019 | $3,322 | $213,800 | $86,900 | $126,900 |
| 2018 | $3,013 | $187,600 | $86,900 | $100,700 |
| 2017 | $2,737 | $170,000 | $86,900 | $83,100 |
| 2016 | $2,578 | $148,500 | $83,200 | $65,300 |
| 2015 | $2,517 | $138,700 | $83,200 | $55,500 |
| 2014 | $2,565 | $141,500 | $83,200 | $58,300 |
V
Seller's Agent in 2024
Vision Realty Group
Laer Realty
(617) 721-0013
213 Total Sales
C
Buyer's Agent in 2024
Cassandra Prophete
Advanced Realty Company
(617) 442-9190
10 Total Sales

Seller's Agent in 2013
Joyce Asack
RE/MAX
(508) 942-7146
46 Total Sales
S
Buyer's Agent in 2013
Susan Foley
Refined Real Estate, LLC
12 Total Sales
Source: MLS Property Information Network (MLS PIN)
MLS Number: 73184838
APN: BROC-000128-000086
Disclaimer: Certain information contained herein is derived from information provided by parties other than Homes.com. All information provided is deemed reliable, but is not guaranteed to be accurate and should be independently verified.
![]() The property listing data and information, or the Images, set forth herein were provided to MLS Property Information Network, Inc. from third party sources, including sellers, lessors and public records, and were compiled by MLS Property Information Network, Inc. The property listing data and information, and the Images, are for the personal, non-commercial use of consumers having a good faith interest in purchasing or leasing listed properties of the type displayed to them and may not be used for any purpose other than to identify prospective properties which such consumers may have a good faith interest in purchasing or leasing. MLS Property Information Network, Inc. and its subscribers disclaim any and all representations and warranties as to the accuracy of the property listing data and information, or as to the accuracy of any of the Images, set forth herein.
The property listing data and information, or the Images, set forth herein were provided to MLS Property Information Network, Inc. from third party sources, including sellers, lessors and public records, and were compiled by MLS Property Information Network, Inc. The property listing data and information, and the Images, are for the personal, non-commercial use of consumers having a good faith interest in purchasing or leasing listed properties of the type displayed to them and may not be used for any purpose other than to identify prospective properties which such consumers may have a good faith interest in purchasing or leasing. MLS Property Information Network, Inc. and its subscribers disclaim any and all representations and warranties as to the accuracy of the property listing data and information, or as to the accuracy of any of the Images, set forth herein.