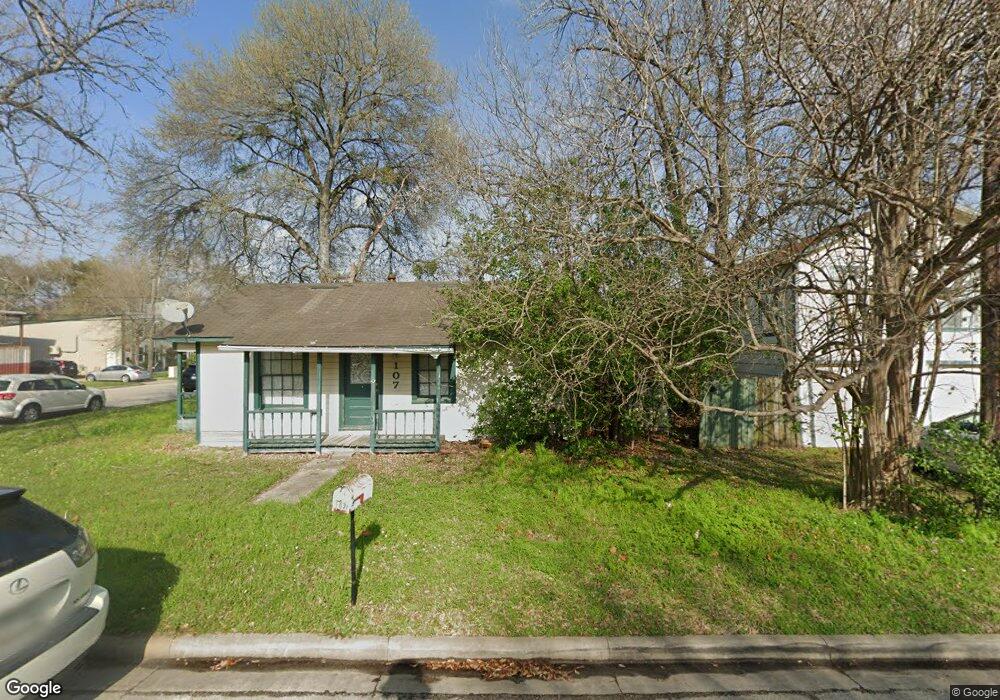
107 N Oak St Tomball, TX 77375
Estimated Value: $118,250 - $423,000
--
Bed
--
Bath
828
Sq Ft
$352/Sq Ft
Est. Value
About This Home
This home is located at 107 N Oak St, Tomball, TX 77375 and is currently estimated at $291,813, approximately $352 per square foot. 107 N Oak St is a home located in Harris County with nearby schools including Tomball Elementary School, Tomball Intermediate School, and Tomball Junior High School.
Ownership History
Date
Name
Owned For
Owner Type
Purchase Details
Closed on
Aug 12, 2015
Sold by
Jarvis W Richard and Jarvis Judy B
Bought by
Hutson Rodney K
Current Estimated Value
Purchase Details
Closed on
Dec 29, 2000
Sold by
Limbaugh Robert S and Limbaugh Lucy D
Bought by
Jarvis W Richard and Jarvis Judy B
Home Financials for this Owner
Home Financials are based on the most recent Mortgage that was taken out on this home.
Original Mortgage
$66,150
Interest Rate
7.78%
Create a Home Valuation Report for This Property
The Home Valuation Report is an in-depth analysis detailing your home's value as well as a comparison with similar homes in the area
Home Values in the Area
Average Home Value in this Area
Purchase History
| Date | Buyer | Sale Price | Title Company |
|---|---|---|---|
| Hutson Rodney K | -- | Alamo Title Co | |
| Jarvis W Richard | -- | Alamo Title Company |
Source: Public Records
Mortgage History
| Date | Status | Borrower | Loan Amount |
|---|---|---|---|
| Previous Owner | Jarvis W Richard | $66,150 |
Source: Public Records
Tax History Compared to Growth
Tax History
| Year | Tax Paid | Tax Assessment Tax Assessment Total Assessment is a certain percentage of the fair market value that is determined by local assessors to be the total taxable value of land and additions on the property. | Land | Improvement |
|---|---|---|---|---|
| 2025 | $1,967 | $61,205 | $37,500 | $23,705 |
| 2024 | $1,967 | $88,885 | $37,500 | $51,385 |
| 2023 | $1,967 | $86,749 | $37,500 | $49,249 |
| 2022 | $1,747 | $77,506 | $37,500 | $40,006 |
| 2021 | $1,632 | $68,806 | $37,500 | $31,306 |
| 2020 | $1,626 | $66,288 | $37,500 | $28,788 |
| 2019 | $1,713 | $67,923 | $37,500 | $30,423 |
| 2018 | $870 | $64,945 | $37,500 | $27,445 |
| 2017 | $1,611 | $63,930 | $37,500 | $26,430 |
| 2016 | $1,298 | $51,505 | $25,000 | $26,505 |
| 2015 | $642 | $51,558 | $25,000 | $26,558 |
| 2014 | $642 | $50,913 | $25,000 | $25,913 |
Source: Public Records
Map
Nearby Homes
- 20734 Open Range Ct
- 18818 Cornelia Fields Ln
- 18723 Buttercup Farms Ln
- 20718 Open Range Ct
- 19951 Epona Creek Dr
- 19935 Epona Creek Dr
- 18707 Buttercup Farms Ln
- 20710 Open Range Ct
- 18826 Cornelia Fields Ln
- 20714 Open Range Ct
- 504 Percival St Unit A
- 505 Percival St
- 516 Clayton St
- 0 N Sycamore St
- TBD Clayton St
- 109 Mcphail St
- 306 E Main St
- 204 Vernon St
- 200 S Vernon St
- 315 Mechanic St
- 401 Commerce St
- 401 Commerce St Unit 1/2
- 401 1/2 Commerce St
- 102 N Oak St
- 404 W Main St
- 408 W Main St
- 402 Commerce St
- 306 Commerce St
- 200 Commerce St
- 302 Commerce St
- 412 W Main St
- 404 Commerce St
- 416 W Main St
- 309 Houston St
- 409 Commerce St
- 409 1/2 Commerce St
- 421 W Main St
- 315 W Main St
- 313 W Main St
- 418 W Main St