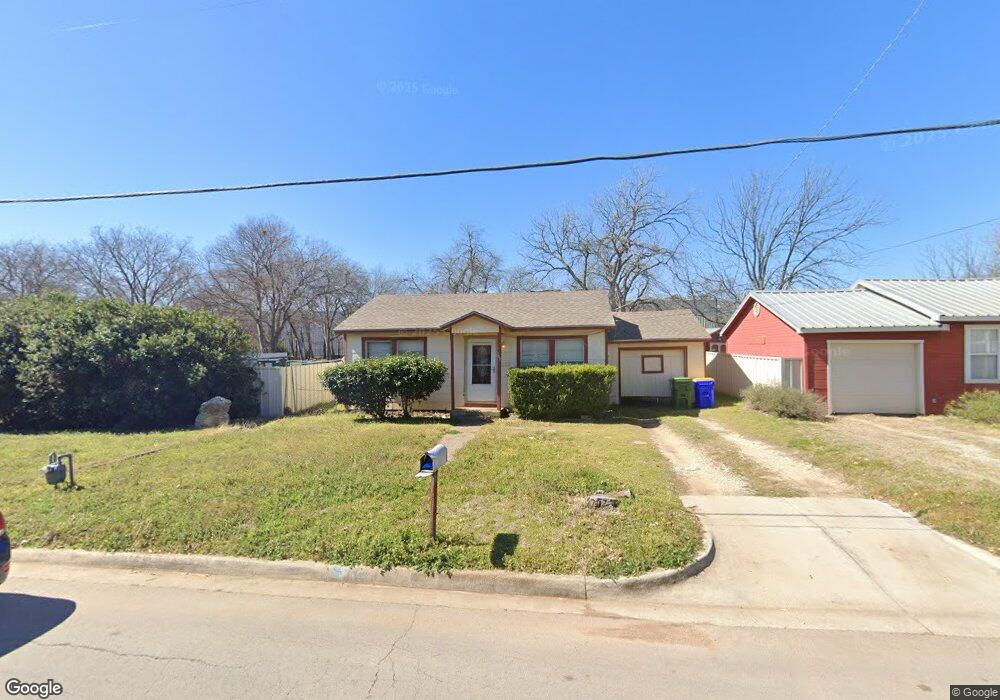
107 N Roe St Fort Worth, TX 76108
Estimated Value: $168,000 - $190,000
2
Beds
1
Bath
868
Sq Ft
$205/Sq Ft
Est. Value
About This Home
This home is located at 107 N Roe St, Fort Worth, TX 76108 and is currently estimated at $177,864, approximately $204 per square foot. 107 N Roe St is a home located in Tarrant County with nearby schools including North Elementary School, Brewer Middle School, and Tannahill Intermediate School.
Ownership History
Date
Name
Owned For
Owner Type
Purchase Details
Closed on
Mar 9, 2012
Sold by
Flores Raymundo
Bought by
Flores Karina A
Current Estimated Value
Purchase Details
Closed on
Jun 28, 2002
Sold by
Starnes D J Bud
Bought by
Flores Raymundo
Home Financials for this Owner
Home Financials are based on the most recent Mortgage that was taken out on this home.
Original Mortgage
$31,200
Outstanding Balance
$15,064
Interest Rate
8.7%
Estimated Equity
$162,800
Purchase Details
Closed on
Nov 29, 2000
Sold by
Curtis Barbara Ann
Bought by
Starnes D J Bud
Home Financials for this Owner
Home Financials are based on the most recent Mortgage that was taken out on this home.
Original Mortgage
$16,000
Interest Rate
7.84%
Create a Home Valuation Report for This Property
The Home Valuation Report is an in-depth analysis detailing your home's value as well as a comparison with similar homes in the area
Home Values in the Area
Average Home Value in this Area
Purchase History
| Date | Buyer | Sale Price | Title Company |
|---|---|---|---|
| Flores Karina A | -- | None Available | |
| Flores Raymundo | -- | Lake Worth Commerce Land Tit | |
| Starnes D J Bud | -- | Lake Worth Commerce Land Tit |
Source: Public Records
Mortgage History
| Date | Status | Borrower | Loan Amount |
|---|---|---|---|
| Open | Flores Raymundo | $31,200 | |
| Previous Owner | Starnes D J Bud | $16,000 |
Source: Public Records
Tax History Compared to Growth
Tax History
| Year | Tax Paid | Tax Assessment Tax Assessment Total Assessment is a certain percentage of the fair market value that is determined by local assessors to be the total taxable value of land and additions on the property. | Land | Improvement |
|---|---|---|---|---|
| 2025 | $715 | $125,429 | $25,000 | $100,429 |
| 2024 | $715 | $125,429 | $25,000 | $100,429 |
| 2023 | $1,636 | $139,216 | $25,000 | $114,216 |
| 2022 | $1,694 | $122,888 | $25,000 | $97,888 |
| 2021 | $1,564 | $111,504 | $25,000 | $86,504 |
| 2020 | $1,432 | $104,734 | $25,000 | $79,734 |
| 2019 | $1,352 | $101,824 | $25,000 | $76,824 |
| 2018 | $784 | $42,725 | $12,000 | $30,725 |
| 2017 | $1,135 | $65,207 | $12,000 | $53,207 |
| 2016 | $1,032 | $46,662 | $12,000 | $34,662 |
| 2015 | $647 | $32,100 | $12,400 | $19,700 |
| 2014 | $647 | $32,100 | $12,400 | $19,700 |
Source: Public Records
Map
Nearby Homes
- 9752 New Bern Dr
- 8017 White Settlement Rd
- 8113 Raymond Ave
- 410 N Cherry Ln
- 200 Waynell St
- 2220 Crested Saguaro St
- 2228 Crested Saguaro St
- 149 Wilson Cliff Dr
- 501 Odie Dr
- 10708 Gun Barrel St
- 10728 Gun Barrel St
- 321 Meadow Park Dr
- 311 Russell St
- 537 June Dr
- 2248 Tierra Madre Blvd
- 8321 Raymond Ave
- 730 S Cherry Ln
- 8203 Delmar St
- 301 Mirike Dr
- 7945 White Settlement Rd
- 109 N Roe St
- 103 N Roe St
- 112 N Roe St
- 108 N Roe St
- 101 N Roe St
- 120 N Roe St
- 117 N Roe St
- 104 N Roe St
- 8000 White Settlement Rd Unit B
- 8000 White Settlement Rd Unit A
- 8000 White Settlement Rd
- 124 N Roe St
- 119 N Roe St
- 126 N Roe St
- 7940 White Settlement Rd
- 123 N Roe St
- 128 N Roe St
- 7931 Raymond Ave
- 7931 Raymond Ave
- 130 N Roe St