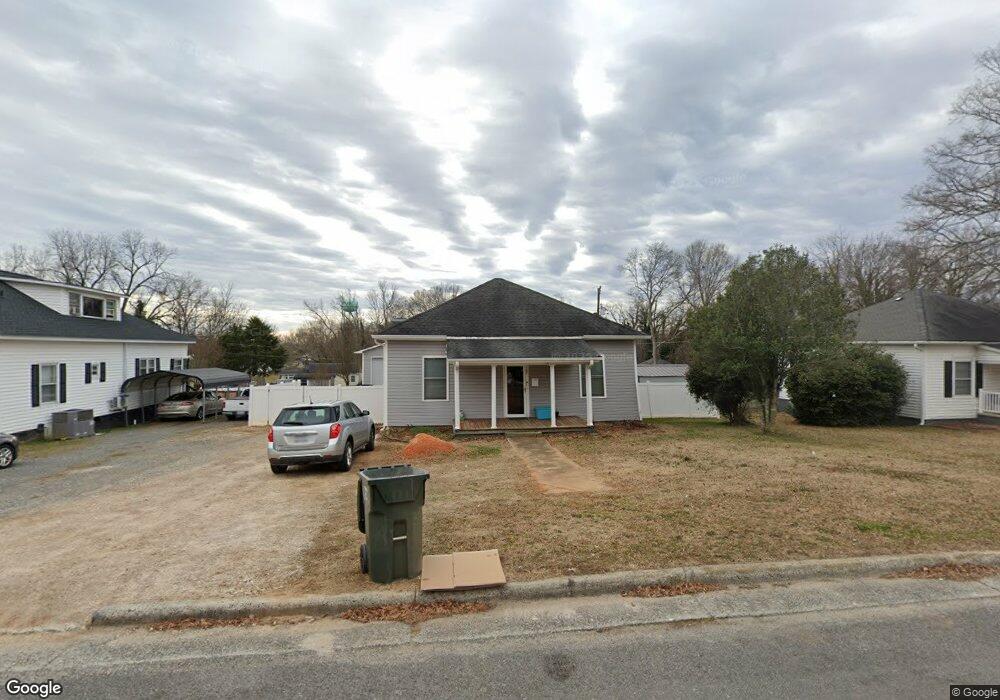
107 Oak St Unit 125 Clover, SC 29710
Estimated Value: $206,000 - $223,927
2
Beds
1
Bath
1,154
Sq Ft
$184/Sq Ft
Est. Value
About This Home
This home is located at 107 Oak St Unit 125, Clover, SC 29710 and is currently estimated at $212,232, approximately $183 per square foot. 107 Oak St Unit 125 is a home located in York County with nearby schools including Larne Elementary School, Clover Middle School, and Clover High School.
Ownership History
Date
Name
Owned For
Owner Type
Purchase Details
Closed on
Dec 29, 2020
Sold by
Eason Frank Edward and Frank Edward Eason Living Trus
Bought by
Mccarter Paige B
Current Estimated Value
Purchase Details
Closed on
Jul 29, 2019
Sold by
Eason Frank E
Bought by
Eason Frank Edward and Frank Edward Eason Living Trust
Purchase Details
Closed on
Jan 6, 2017
Sold by
Duncan Sherry
Bought by
Eason Frank E
Purchase Details
Closed on
Sep 22, 2008
Sold by
Duncan Jeffrey Ray
Bought by
Duncan Sherry
Home Financials for this Owner
Home Financials are based on the most recent Mortgage that was taken out on this home.
Original Mortgage
$60,000
Interest Rate
6.75%
Mortgage Type
Adjustable Rate Mortgage/ARM
Purchase Details
Closed on
Aug 26, 2003
Sold by
Killian Olin F
Bought by
Duncan Sherry and Duncan Jeffrey Ray
Purchase Details
Closed on
Sep 12, 2000
Sold by
Killian Ethel W
Bought by
Killian Olin F
Create a Home Valuation Report for This Property
The Home Valuation Report is an in-depth analysis detailing your home's value as well as a comparison with similar homes in the area
Home Values in the Area
Average Home Value in this Area
Purchase History
| Date | Buyer | Sale Price | Title Company |
|---|---|---|---|
| Mccarter Paige B | -- | None Available | |
| Eason Frank Edward | -- | None Available | |
| Eason Frank E | $79,469 | None Available | |
| Duncan Sherry | -- | -- | |
| Duncan Sherry | $39,353 | -- | |
| Killian Olin F | $37,000 | -- |
Source: Public Records
Mortgage History
| Date | Status | Borrower | Loan Amount |
|---|---|---|---|
| Previous Owner | Duncan Sherry | $60,000 |
Source: Public Records
Tax History Compared to Growth
Tax History
| Year | Tax Paid | Tax Assessment Tax Assessment Total Assessment is a certain percentage of the fair market value that is determined by local assessors to be the total taxable value of land and additions on the property. | Land | Improvement |
|---|---|---|---|---|
| 2025 | $1,353 | $5,439 | $990 | $4,449 |
| 2024 | $1,204 | $4,729 | $640 | $4,089 |
| 2023 | $775 | $3,059 | $640 | $2,419 |
| 2022 | $700 | $3,059 | $640 | $2,419 |
| 2021 | -- | $3,059 | $640 | $2,419 |
| 2020 | $1,897 | $4,271 | $0 | $0 |
| 2019 | $1,964 | $4,200 | $0 | $0 |
| 2018 | $1,933 | $4,200 | $0 | $0 |
| 2017 | $530 | $2,400 | $0 | $0 |
| 2016 | $526 | $2,400 | $0 | $0 |
| 2014 | $531 | $2,400 | $640 | $1,760 |
| 2013 | $531 | $2,500 | $640 | $1,860 |
Source: Public Records
Map
Nearby Homes
- 111 Sunset Dr
- 206 Frances St
- 229 Price St
- 132 Oak St
- 909 S Main St
- 206 Mcconnell St
- 7+/- Acres Forest St
- 208 Forest St
- 202 Alexander St
- 312 Flat Rock St
- 534 Pennyfields Ln
- 210 Smith St
- 507 Flatrock St
- 107 Mint St
- 395 Lone Tree Ln
- 107 Pressley St
- 203 Kings Mountain St
- 205 Kings Mountain St
- 101 Ridge Ave
- 221 Kings Mountain St