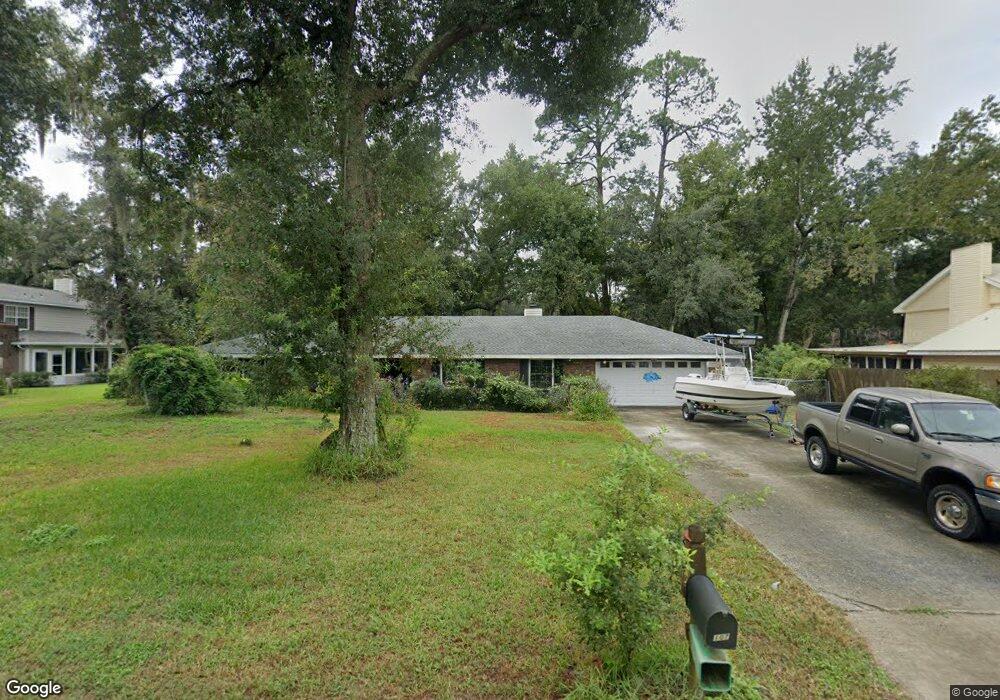
107 Paradise Marsh Cir Brunswick, GA 31525
Estimated Value: $227,495 - $284,000
3
Beds
2
Baths
1,560
Sq Ft
$165/Sq Ft
Est. Value
About This Home
This home is located at 107 Paradise Marsh Cir, Brunswick, GA 31525 and is currently estimated at $257,374, approximately $164 per square foot. 107 Paradise Marsh Cir is a home located in Glynn County with nearby schools including Altama Elementary School, Needwood Middle School, and Glynn Academy.
Ownership History
Date
Name
Owned For
Owner Type
Purchase Details
Closed on
Mar 21, 2012
Sold by
Monroe Gerald
Bought by
Monroe Gerald and Monroe Laura
Current Estimated Value
Home Financials for this Owner
Home Financials are based on the most recent Mortgage that was taken out on this home.
Original Mortgage
$184,769
Outstanding Balance
$117,380
Interest Rate
2.5%
Mortgage Type
VA
Estimated Equity
$139,994
Purchase Details
Closed on
Feb 7, 2007
Sold by
Monroe Gerald
Bought by
Monroe Gerald and Monroe Anderson Laura
Home Financials for this Owner
Home Financials are based on the most recent Mortgage that was taken out on this home.
Original Mortgage
$174,661
Interest Rate
6.17%
Mortgage Type
VA
Purchase Details
Closed on
Mar 22, 2005
Sold by
Harrison Maynard P
Bought by
Evans Charles Travis
Home Financials for this Owner
Home Financials are based on the most recent Mortgage that was taken out on this home.
Original Mortgage
$117,200
Interest Rate
5.62%
Mortgage Type
New Conventional
Create a Home Valuation Report for This Property
The Home Valuation Report is an in-depth analysis detailing your home's value as well as a comparison with similar homes in the area
Home Values in the Area
Average Home Value in this Area
Purchase History
| Date | Buyer | Sale Price | Title Company |
|---|---|---|---|
| Monroe Gerald | -- | -- | |
| Monroe Gerald | -- | -- | |
| Monroe Gerald | $169,000 | -- | |
| Evans Charles Travis | $146,500 | -- |
Source: Public Records
Mortgage History
| Date | Status | Borrower | Loan Amount |
|---|---|---|---|
| Open | Monroe Gerald | $184,769 | |
| Previous Owner | Monroe Gerald | $174,661 | |
| Previous Owner | Evans Charles Travis | $117,200 | |
| Previous Owner | Evans Charles Travis | $29,300 |
Source: Public Records
Tax History Compared to Growth
Tax History
| Year | Tax Paid | Tax Assessment Tax Assessment Total Assessment is a certain percentage of the fair market value that is determined by local assessors to be the total taxable value of land and additions on the property. | Land | Improvement |
|---|---|---|---|---|
| 2025 | $1,948 | $77,680 | $8,880 | $68,800 |
| 2024 | $1,988 | $79,280 | $6,640 | $72,640 |
| 2023 | $961 | $69,040 | $6,640 | $62,400 |
| 2022 | $1,340 | $53,440 | $6,640 | $46,800 |
| 2021 | $1,356 | $52,600 | $6,640 | $45,960 |
| 2020 | $1,166 | $44,920 | $6,640 | $38,280 |
| 2019 | $1,166 | $44,920 | $6,640 | $38,280 |
| 2018 | $1,061 | $41,120 | $6,640 | $34,480 |
| 2017 | $849 | $39,200 | $6,640 | $32,560 |
| 2016 | $801 | $32,760 | $4,440 | $28,320 |
| 2015 | $804 | $32,760 | $4,440 | $28,320 |
| 2014 | $804 | $32,760 | $4,440 | $28,320 |
Source: Public Records
Map
Nearby Homes
- 109 King Cotton Rd
- 131 Paradise Marsh Cir
- 138 Crossbrook Dr
- 526 Old Mission Rd
- 171 Drayton Cir
- 60 Powers Landing
- 131 Drayton Cir
- 118 Drayton Cir
- 6 Quail Run
- 3855 Darien Hwy
- 167 Zachary Dr
- 155 Mcdowell Ave
- 120 N Palm Dr
- 230 Yacht Rd
- 103 N Palm Dr
- 16 Hidden Harbor Rd
- 11 Hidden Harbor Rd
- 515 Nottingham Dr
- 116 Chatford Cir
- 118 Saxon St
- 602 Indian Mound Rd
- 111 Paradise Marsh Cir
- 110 Paradise Marsh Cir
- 122 King Cotton Rd
- 700 Indian Mound Rd
- 118 King Cotton Rd
- 113 Paradise Marsh Cir
- 128 King Cotton Rd
- 116 Paradise Marsh Cir
- 235 Paradise Marsh Cir
- 115 Paradise Marsh Cir
- 701 Indian Mound Rd
- 118 Crossbrook Dr
- 110 King Cotton Rd
- 116 Crossbrook Dr
- 132 King Cotton Rd
- 703 Indian Mound Rd
- 704 Indian Mound Rd
- 119 Paradise Marsh Cir
- 231 Paradise Marsh Cir