Estimated Value: $699,440 - $863,000
About This Home
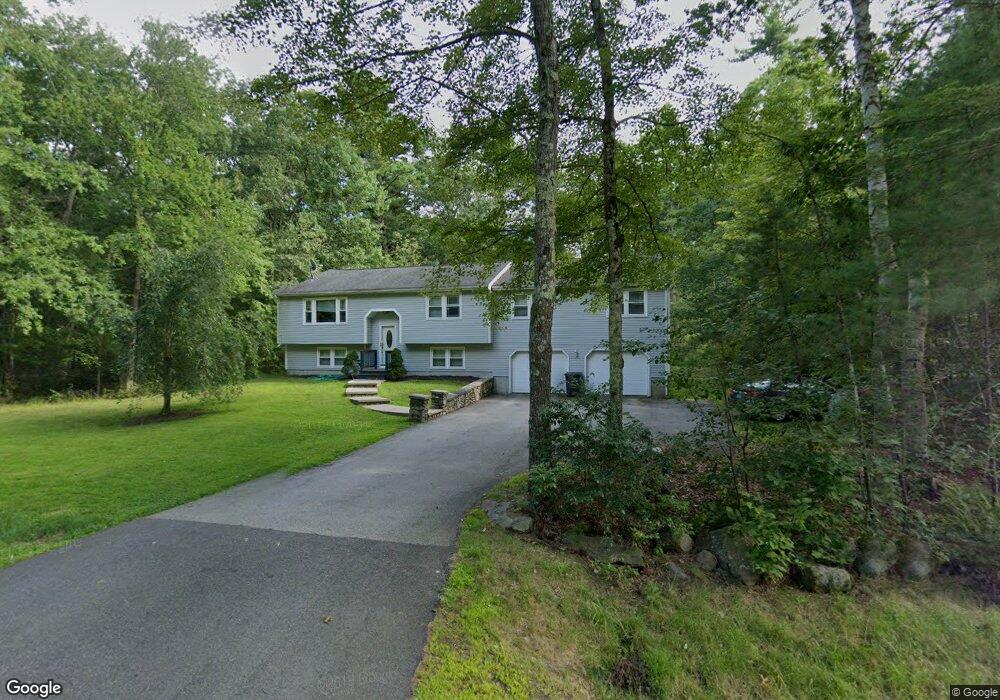
This home is located at 107 Pelham Rd, Salem, NH 03079 and is currently estimated at $744,360, approximately $436 per square foot. 107 Pelham Rd is a home located in Rockingham County with nearby schools including Mary A. Fisk Elementary School, Woodbury School, and Salem High School.
Ownership History
We collect this data history from publicly available records. To have your information removed, we recommend requesting removal directly through your county’s website.
Purchase Details
Home Financials for this Owner
Home Financials are based on the most recent Mortgage that was taken out on this home.Purchase Details
Home Financials for this Owner
Home Financials are based on the most recent Mortgage that was taken out on this home.Purchase Details
Home Financials for this Owner
Home Financials are based on the most recent Mortgage that was taken out on this home.Purchase History
We collect this data history from publicly available records. To have your information removed, we recommend requesting removal directly through your county’s website.
| Date | Buyer | Sale Price | Title Company |
|---|---|---|---|
| -- | -- | ||
| $252,000 | -- | ||
| $240,000 | -- |
Mortgage History
We collect this data history from publicly available records. To have your information removed, we recommend requesting removal directly through your county’s website.
| Date | Status | Borrower | Loan Amount |
|---|---|---|---|
| Open | $223,100 | ||
| Previous Owner | $252,000 | ||
| Previous Owner | $192,000 |
Tax History
We collect this data history from publicly available records. To have your information removed, we recommend requesting removal directly through your county’s website.
| Year | Tax Paid | Tax Assessment Tax Assessment Total Assessment is a certain percentage of the fair market value that is determined by local assessors to be the total taxable value of land and additions on the property. | Land | Improvement |
|---|---|---|---|---|
| 2025 | $9,659 | $531,900 | $194,300 | $337,600 |
| 2024 | $9,361 | $531,900 | $194,300 | $337,600 |
| 2023 | $9,021 | $531,900 | $194,300 | $337,600 |
| 2022 | $8,537 | $531,900 | $194,300 | $337,600 |
| 2021 | $8,500 | $531,900 | $194,300 | $337,600 |
| 2020 | $7,595 | $344,900 | $138,900 | $206,000 |
| 2019 | $7,581 | $344,900 | $138,900 | $206,000 |
| 2018 | $7,315 | $338,500 | $138,900 | $199,600 |
| 2017 | $7,054 | $338,500 | $138,900 | $199,600 |
| 2016 | $6,916 | $338,500 | $138,900 | $199,600 |
| 2015 | $6,378 | $298,200 | $137,700 | $160,500 |
| 2014 | $6,200 | $298,200 | $137,700 | $160,500 |
| 2013 | $6,101 | $298,200 | $137,700 | $160,500 |
Map
- 6-18 Mary Anthony Dr
- 1 Cindy Ave
- 155 Lancaster Farm Rd
- 60 Stanley Brook Dr
- 47 Campbell St
- 150 Lowell Rd
- 56 Nelson St
- 123 Brady Ave
- 19 Winter St
- 30 Winter St
- 10 Cristy Rd
- 1152 Bridge St
- 17 Rolling Ridge Rd
- 29 Lowell Rd Unit 8
- 29 Lowell Rd Unit 43
- 29 Lowell Rd Unit 18
- 76 Marblehead Rd
- 97 W Shore Rd
- 95 Lake Shore Rd
- 34 N Policy St Unit 34
Ask me questions while you tour the home.