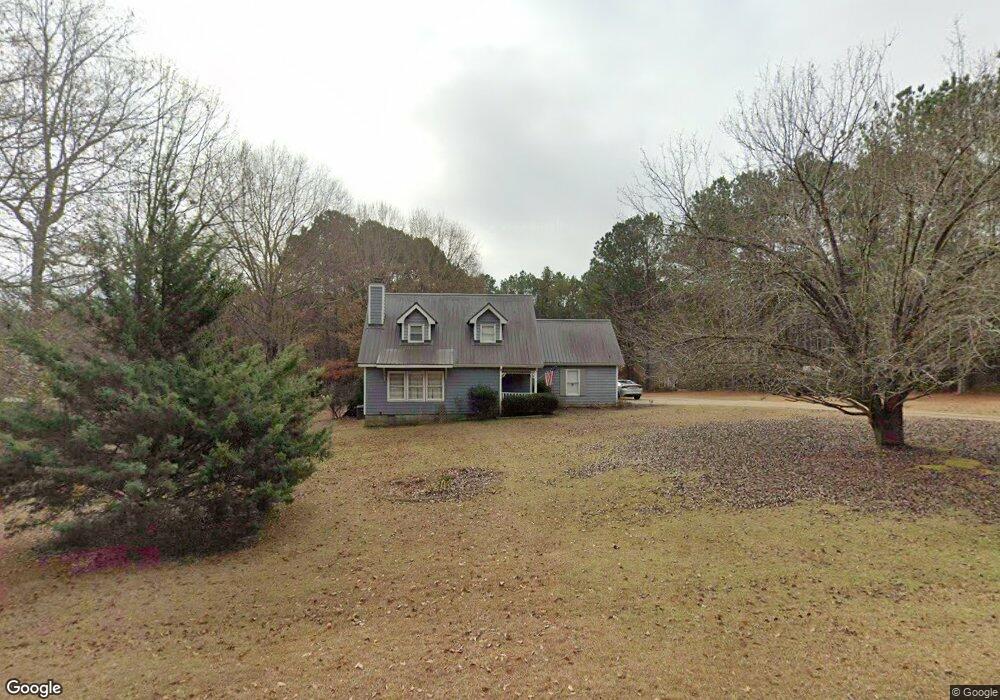
107 Pinebrook Dr Lagrange, GA 30240
Estimated Value: $176,000 - $240,000
3
Beds
2
Baths
1,496
Sq Ft
$146/Sq Ft
Est. Value
About This Home
This home is located at 107 Pinebrook Dr, Lagrange, GA 30240 and is currently estimated at $218,350, approximately $145 per square foot. 107 Pinebrook Dr is a home located in Troup County with nearby schools including Long Cane Elementary School, Berta Weathersbee Elementary School, and Whitesville Road Elementary School.
Ownership History
Date
Name
Owned For
Owner Type
Purchase Details
Closed on
Apr 21, 2017
Sold by
Federal Hm Ln Mtg Corp
Bought by
Mcrae Larry R
Current Estimated Value
Home Financials for this Owner
Home Financials are based on the most recent Mortgage that was taken out on this home.
Original Mortgage
$93,279
Outstanding Balance
$77,477
Interest Rate
4.4%
Mortgage Type
FHA
Estimated Equity
$140,873
Purchase Details
Closed on
Nov 1, 2016
Bought by
Federal Home Loan Mortgage Corporation
Purchase Details
Closed on
Jun 29, 2007
Sold by
Stevens Bruce H
Bought by
Ray Debra
Home Financials for this Owner
Home Financials are based on the most recent Mortgage that was taken out on this home.
Original Mortgage
$117,500
Interest Rate
6.37%
Mortgage Type
New Conventional
Purchase Details
Closed on
Apr 15, 1994
Sold by
Nce Of Thomaston
Bought by
Stevens Bruce H and Stevens Tracie S
Purchase Details
Closed on
Jan 19, 1994
Sold by
Spinks Brown Durand Inc
Bought by
Nce Of Thomaston
Purchase Details
Closed on
Feb 12, 1993
Sold by
Jane Charles and Jane Hatcher
Bought by
Spinks Brown Durand Inc
Create a Home Valuation Report for This Property
The Home Valuation Report is an in-depth analysis detailing your home's value as well as a comparison with similar homes in the area
Purchase History
| Date | Buyer | Sale Price | Title Company |
|---|---|---|---|
| Mcrae Larry R | $95,000 | -- | |
| Federal Home Loan Mortgage Corporation | -- | -- | |
| M & T Bank | $75,128 | -- | |
| Ray Debra | $117,500 | -- | |
| Stevens Bruce H | $73,900 | -- | |
| Nce Of Thomaston | $9,600 | -- | |
| Spinks Brown Durand Inc | -- | -- |
Source: Public Records
Mortgage History
| Date | Status | Borrower | Loan Amount |
|---|---|---|---|
| Open | Mcrae Larry R | $93,279 | |
| Previous Owner | Ray Debra | $117,500 |
Source: Public Records
Tax History
| Year | Tax Paid | Tax Assessment Tax Assessment Total Assessment is a certain percentage of the fair market value that is determined by local assessors to be the total taxable value of land and additions on the property. | Land | Improvement |
|---|---|---|---|---|
| 2025 | $1,774 | $65,032 | $14,000 | $51,032 |
| 2024 | $1,768 | $64,840 | $14,000 | $50,840 |
| 2023 | $1,829 | $67,080 | $14,000 | $53,080 |
| 2022 | $1,475 | $52,840 | $8,000 | $44,840 |
| 2021 | $1,497 | $49,640 | $8,000 | $41,640 |
| 2020 | $1,497 | $49,640 | $8,000 | $41,640 |
| 2019 | $1,437 | $47,640 | $6,000 | $41,640 |
| 2018 | $1,146 | $45,520 | $6,000 | $39,520 |
| 2017 | $1,373 | $45,520 | $6,000 | $39,520 |
| 2016 | $1,279 | $44,388 | $6,000 | $38,388 |
| 2015 | $1,281 | $44,388 | $6,000 | $38,388 |
| 2014 | $1,370 | $47,256 | $4,628 | $42,628 |
| 2013 | -- | $47,080 | $4,628 | $42,452 |
Source: Public Records
Map
Nearby Homes
- 0 Cannonville Rd
- 102 Bridgewater Dr
- 105 Redwood Dr
- 107 Sweetwater Ct
- 107 Waters Edge Dr
- 640 Hudson Rd
- 5714 W Point Rd
- 22 Freeman Rd
- 266 Glass Bridge Rd
- 0 Glass Bridge Rd Unit 10679358
- Sandtown Road Unit: 1 2+ - Acre
- 0 Sandtown Rd Unit 10255987
- 288 Bradfield Dr
- 119 Plymouth Dr
- 808 S Fling Rd
- 2239 Pegasus Pkwy
- 124 Lincoln Ln
- 0 Warner Rd Unit 10686116
- 648 Warner Rd
- 90 Hickory Ln
- 103 Pinebrook Ct
- 100 Upland Ct
- 106 Pinebrook Dr
- 105 Pinebrook Ct
- 201 Upland Ct
- 102 Upland Ct
- 102 Pinebrook Ct
- 104 Pinebrook Ct
- 201 Pinebrook Ct
- 100 Pinebrook Ct
- 202 Pinebrook Ct
- 203 Upland Ct
- 103 Upland Ct
- 101 Upland Ct
- 203 Pinebrook Ct
- 200 Upland Ct
- 204 Pinebrook Ct
- 205 Upland Ct
- 101 Pinebrook Dr
- 102 Pinebrook Dr
Your Personal Tour Guide
Ask me questions while you tour the home.