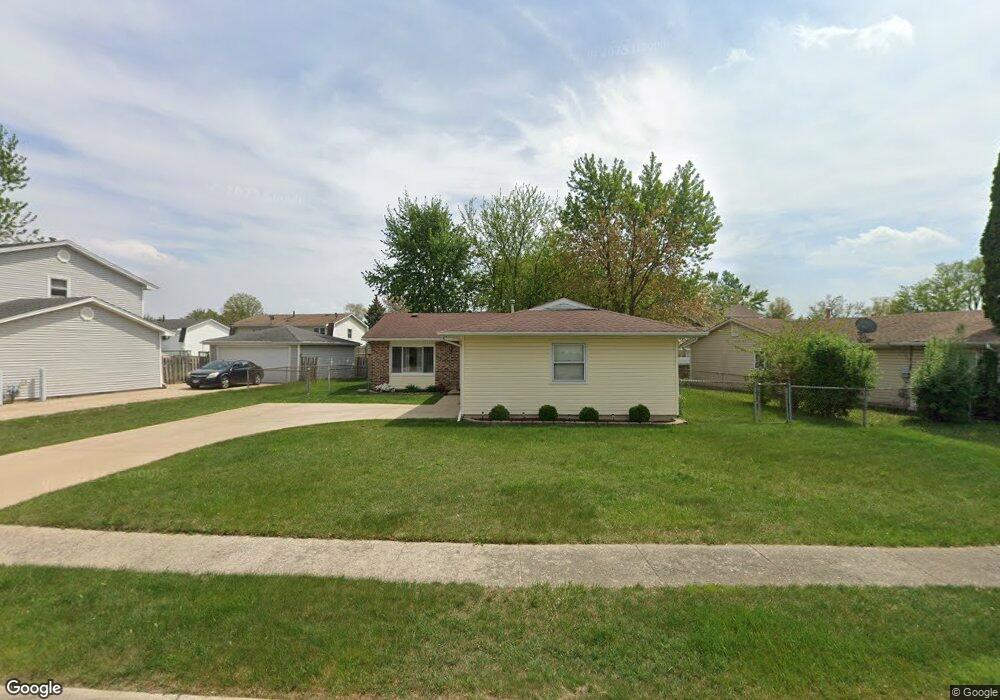
107 Poplar St Glendale Heights, IL 60139
Estimated Value: $304,000 - $348,000
3
Beds
1
Bath
1,214
Sq Ft
$272/Sq Ft
Est. Value
About This Home
This home is located at 107 Poplar St, Glendale Heights, IL 60139 and is currently estimated at $330,773, approximately $272 per square foot. 107 Poplar St is a home located in DuPage County with nearby schools including Americana Intermediate School, Glenside Middle School, and Glenbard North High School.
Ownership History
Date
Name
Owned For
Owner Type
Purchase Details
Closed on
Apr 28, 2004
Sold by
Wojcik Stanislaw and Wojcik Halina
Bought by
Blanco Raul and Blanco Crisanta
Current Estimated Value
Home Financials for this Owner
Home Financials are based on the most recent Mortgage that was taken out on this home.
Original Mortgage
$148,800
Outstanding Balance
$71,772
Interest Rate
5.91%
Mortgage Type
Purchase Money Mortgage
Estimated Equity
$259,001
Purchase Details
Closed on
Nov 28, 2001
Sold by
Acharya Omdutt
Bought by
Wojcik Barbara and Wojcik Stanislaw
Home Financials for this Owner
Home Financials are based on the most recent Mortgage that was taken out on this home.
Original Mortgage
$135,850
Interest Rate
6.64%
Purchase Details
Closed on
Jun 11, 2001
Sold by
Luis Angel C and Luis Corazon T
Bought by
Acharya Omdutt
Home Financials for this Owner
Home Financials are based on the most recent Mortgage that was taken out on this home.
Original Mortgage
$98,400
Interest Rate
7.62%
Create a Home Valuation Report for This Property
The Home Valuation Report is an in-depth analysis detailing your home's value as well as a comparison with similar homes in the area
Home Values in the Area
Average Home Value in this Area
Purchase History
| Date | Buyer | Sale Price | Title Company |
|---|---|---|---|
| Blanco Raul | $186,000 | Pntn | |
| Wojcik Barbara | $143,000 | -- | |
| Acharya Omdutt | $123,000 | -- |
Source: Public Records
Mortgage History
| Date | Status | Borrower | Loan Amount |
|---|---|---|---|
| Open | Blanco Raul | $148,800 | |
| Previous Owner | Wojcik Barbara | $135,850 | |
| Previous Owner | Acharya Omdutt | $98,400 | |
| Closed | Blanco Raul | $37,200 |
Source: Public Records
Tax History Compared to Growth
Tax History
| Year | Tax Paid | Tax Assessment Tax Assessment Total Assessment is a certain percentage of the fair market value that is determined by local assessors to be the total taxable value of land and additions on the property. | Land | Improvement |
|---|---|---|---|---|
| 2024 | $6,910 | $83,522 | $24,637 | $58,885 |
| 2023 | $6,658 | $76,380 | $22,530 | $53,850 |
| 2022 | $6,106 | $66,860 | $22,020 | $44,840 |
| 2021 | $5,770 | $63,520 | $20,920 | $42,600 |
| 2020 | $5,550 | $61,970 | $20,410 | $41,560 |
| 2019 | $5,368 | $59,550 | $19,610 | $39,940 |
| 2018 | $6,168 | $60,840 | $19,110 | $41,730 |
| 2017 | $5,977 | $56,390 | $17,710 | $38,680 |
| 2016 | $5,741 | $52,190 | $16,390 | $35,800 |
| 2015 | $5,628 | $48,700 | $15,290 | $33,410 |
| 2014 | $6,103 | $51,910 | $16,300 | $35,610 |
| 2013 | $6,026 | $53,690 | $16,860 | $36,830 |
Source: Public Records
Map
Nearby Homes
- 1760 Lombard Ct
- 200 Ahmed Ct
- 203 Ahmed Ct
- 10 W Schubert Ave
- 10 W Drummond Ave
- 251 Polo Club Dr
- 10 W Nevada Ave
- 25 W Wrightwood Ave
- 1900 Basswood Ln
- 307 E Alpine Dr
- 39 Mill Pond Dr
- 89 Stonefield Dr
- 67 Stonefield Dr
- 133 Harding Ct
- 2018 Stonefield Dr
- 367 E Lincoln Ave
- 2N643 Diane Ave
- 134 W Montana Ave
- 1943 Towner Ln
- 152 W Montana Ave