Estimated Value: $216,555 - $240,000
--
Bed
--
Bath
1,929
Sq Ft
$119/Sq Ft
Est. Value
About This Home
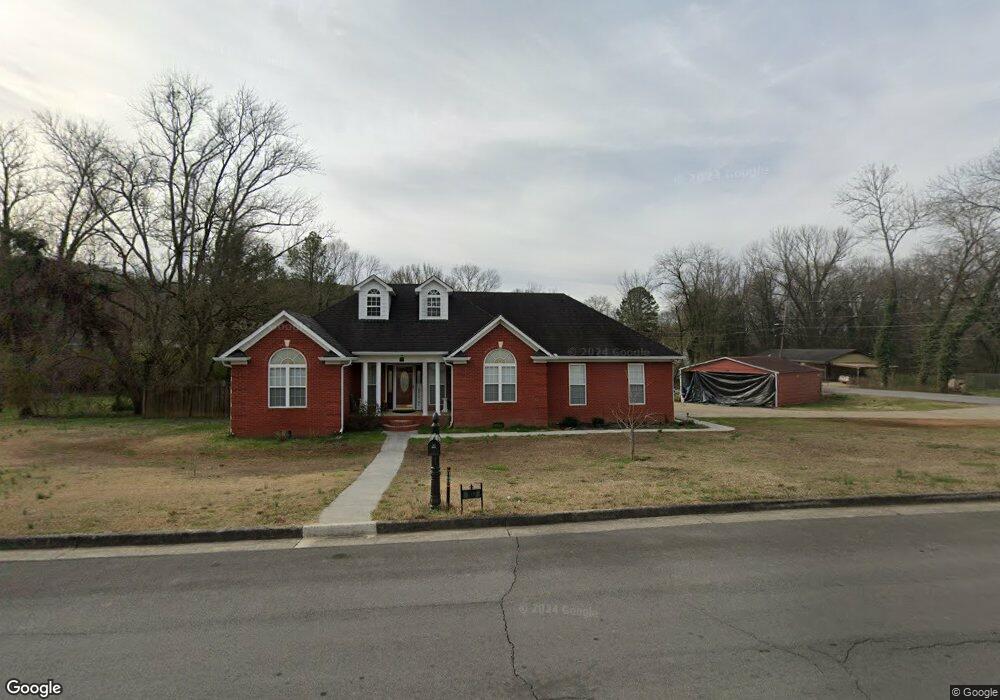
This home is located at 107 Porter St SW, Rome, GA 30161 and is currently estimated at $230,139, approximately $119 per square foot. 107 Porter St SW is a home located in Floyd County with nearby schools including Dan McCarty Middle School, Rome High School, and Darlington School.
Ownership History
Date
Name
Owned For
Owner Type
Purchase Details
Closed on
Apr 27, 2001
Sold by
Jordan Jimmy Eugene
Bought by
Sublett Eddie and Sublett Kiki P
Current Estimated Value
Purchase Details
Closed on
May 20, 1996
Bought by
P and R
Purchase Details
Closed on
Dec 31, 1995
Bought by
P and R
Purchase Details
Closed on
Oct 18, 1994
Sold by
Sutton Louise C Trustee Of "The Chandler
Bought by
Jordan Jimmy Eugene
Purchase Details
Closed on
Sep 27, 1991
Sold by
Chandler H J
Bought by
Sutton Louise C Trustee Of "The Chandler
Purchase Details
Closed on
Jun 4, 1990
Bought by
P and R
Purchase Details
Closed on
Apr 5, 1967
Bought by
P and R
Purchase Details
Closed on
Sep 1, 1963
Sold by
Clower E J
Bought by
Chandler H J
Purchase Details
Closed on
Aug 16, 1963
Sold by
Chandler H J
Bought by
Clower E J
Purchase Details
Closed on
Jan 1, 1901
Bought by
Chandler H J
Create a Home Valuation Report for This Property
The Home Valuation Report is an in-depth analysis detailing your home's value as well as a comparison with similar homes in the area
Home Values in the Area
Average Home Value in this Area
Purchase History
| Date | Buyer | Sale Price | Title Company |
|---|---|---|---|
| Sublett Eddie | $222,600 | -- | |
| P | -- | -- | |
| P | -- | -- | |
| Jordan Jimmy Eugene | -- | -- | |
| Sutton Louise C Trustee Of "The Chandler | -- | -- | |
| P | -- | -- | |
| P | -- | -- | |
| Chandler H J | -- | -- | |
| Clower E J | -- | -- | |
| Chandler H J | -- | -- |
Source: Public Records
Tax History Compared to Growth
Tax History
| Year | Tax Paid | Tax Assessment Tax Assessment Total Assessment is a certain percentage of the fair market value that is determined by local assessors to be the total taxable value of land and additions on the property. | Land | Improvement |
|---|---|---|---|---|
| 2024 | $1,884 | $101,899 | $12,804 | $89,095 |
| 2023 | $2,540 | $98,005 | $11,640 | $86,365 |
| 2022 | $2,065 | $69,903 | $9,312 | $60,591 |
| 2021 | $2,008 | $64,799 | $9,312 | $55,487 |
| 2020 | $1,948 | $60,559 | $7,275 | $53,284 |
| 2019 | $1,891 | $58,288 | $7,275 | $51,013 |
| 2018 | $1,849 | $55,895 | $7,275 | $48,620 |
| 2017 | $1,817 | $54,012 | $7,275 | $46,737 |
| 2016 | $1,815 | $53,613 | $7,240 | $46,373 |
| 2015 | $1,722 | $53,613 | $7,240 | $46,373 |
| 2014 | $1,722 | $53,613 | $7,240 | $46,373 |
Source: Public Records
Map
Nearby Homes
- 3 Porter St SW
- 515 Hardy Ave SW
- 529 Branham Ave SW
- 410 Hardy Ave SW
- 3 Grover St SW
- 107 Butler St SW
- 515 Harper Ave SW
- 218 Wilson Ave SW
- 334 Branham Ave SW
- 111 Lookout Cir SW
- 113 Lookout Cir SW
- 110 Cherokee St SW
- 115 Lookout Cir SW
- 235 Pennington Ave SW
- 515 S Broad St SW
- 11 Blacks Bluff Rd SW
- 5 Jervis St SW
- 13 N Blanche Ave SW
- 232 S Broad St SW
- 105 Porter St SW
- 0 Porter St SW Unit 8328135
- 0 Porter St SW Unit 8087441
- 0 Porter St SW Unit 7481815
- 0 Porter St SW Unit 8450756
- 0 Porter St SW Unit 7479934
- 103 Porter St SW
- 203 Porter St SW
- 603 Nixon Ave SW
- 604 Hardy Ave SW
- 200 Porter St SW
- 602 Hardy Ave SW
- 108 Porter St SW
- 101 Porter St SW
- 110 Porter St SW
- 106 Porter St SW
- 602 Nixon Ave SW
- 102 Porter St SW
- 205 Porter St SW
- 100 Porter St SW