Estimated Value: $205,000 - $236,000
3
Beds
2
Baths
1,354
Sq Ft
$164/Sq Ft
Est. Value
About This Home
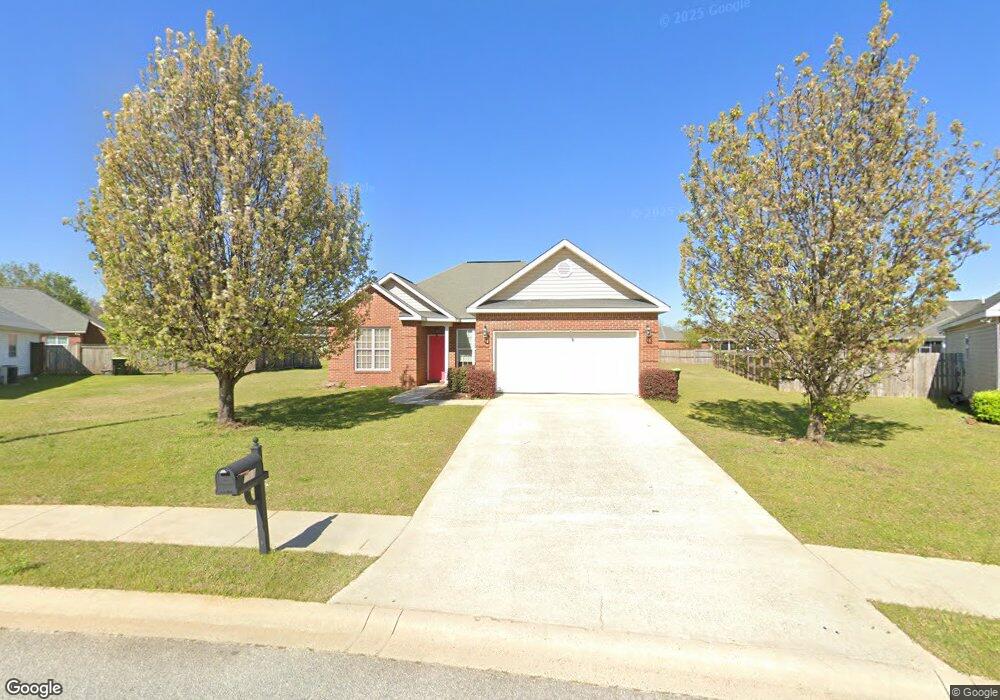
This home is located at 107 Preston Ln, Byron, GA 31008 and is currently estimated at $222,616, approximately $164 per square foot. 107 Preston Ln is a home located in Peach County with nearby schools including Byron Elementary School, Byron Middle School, and Peach County High School.
Ownership History
Date
Name
Owned For
Owner Type
Purchase Details
Closed on
Jul 1, 2020
Sold by
Dean Jennifer Amanda
Bought by
Dean Jennifer A and Dean Matthew J
Current Estimated Value
Home Financials for this Owner
Home Financials are based on the most recent Mortgage that was taken out on this home.
Original Mortgage
$112,000
Outstanding Balance
$99,314
Interest Rate
3.1%
Mortgage Type
New Conventional
Estimated Equity
$123,302
Purchase Details
Closed on
Feb 28, 2006
Sold by
Project Development & Ma
Bought by
Dean Jennifer Amanda
Home Financials for this Owner
Home Financials are based on the most recent Mortgage that was taken out on this home.
Original Mortgage
$121,788
Interest Rate
6.19%
Mortgage Type
FHA
Purchase Details
Closed on
Jan 21, 2005
Sold by
Preston Development Llc
Bought by
Project Development & Management Llc
Purchase Details
Closed on
Oct 22, 2004
Bought by
Preston Development Llc
Create a Home Valuation Report for This Property
The Home Valuation Report is an in-depth analysis detailing your home's value as well as a comparison with similar homes in the area
Home Values in the Area
Average Home Value in this Area
Purchase History
| Date | Buyer | Sale Price | Title Company |
|---|---|---|---|
| Dean Jennifer A | -- | -- | |
| Dean Jennifer Amanda | $123,700 | -- | |
| Project Development & Management Llc | -- | -- | |
| Preston Development Llc | -- | -- |
Source: Public Records
Mortgage History
| Date | Status | Borrower | Loan Amount |
|---|---|---|---|
| Open | Dean Jennifer A | $112,000 | |
| Previous Owner | Dean Jennifer Amanda | $121,788 |
Source: Public Records
Tax History Compared to Growth
Tax History
| Year | Tax Paid | Tax Assessment Tax Assessment Total Assessment is a certain percentage of the fair market value that is determined by local assessors to be the total taxable value of land and additions on the property. | Land | Improvement |
|---|---|---|---|---|
| 2024 | $2,085 | $59,920 | $8,720 | $51,200 |
| 2023 | $2,068 | $59,080 | $7,000 | $52,080 |
| 2022 | $1,364 | $52,680 | $7,000 | $45,680 |
| 2021 | $1,341 | $44,960 | $7,000 | $37,960 |
| 2020 | $1,331 | $44,640 | $7,000 | $37,640 |
| 2019 | $1,338 | $44,640 | $7,000 | $37,640 |
| 2018 | $1,345 | $44,640 | $7,000 | $37,640 |
| 2017 | $1,317 | $43,560 | $7,000 | $36,560 |
| 2016 | $1,311 | $43,560 | $7,000 | $36,560 |
| 2015 | $1,314 | $43,560 | $7,000 | $36,560 |
| 2014 | $1,316 | $43,560 | $7,000 | $36,560 |
| 2013 | -- | $43,560 | $7,000 | $36,560 |
Source: Public Records
Map
Nearby Homes
- 109 Preston Ln
- 105 Preston Ln
- 102 Manchester Ln
- 100 Manchester Ln
- 108 Manchester Ln
- 110 Manchester Ln
- 110 Manchester Ln Unit 8
- 201 Manchester Ln Unit 2
- 201 Manchester Ln
- 111 Preston Ln
- 103 Preston Ln
- 112 Manchester Ln
- 102 Preston Ln
- 106 Manchester Ln
- 114 Manchester Ln
- 203 Manchester Ln
- 113 Preston Ln
- 113 Preston Ln Unit 7
- 101 Preston Ln
- 104 Preston Ln