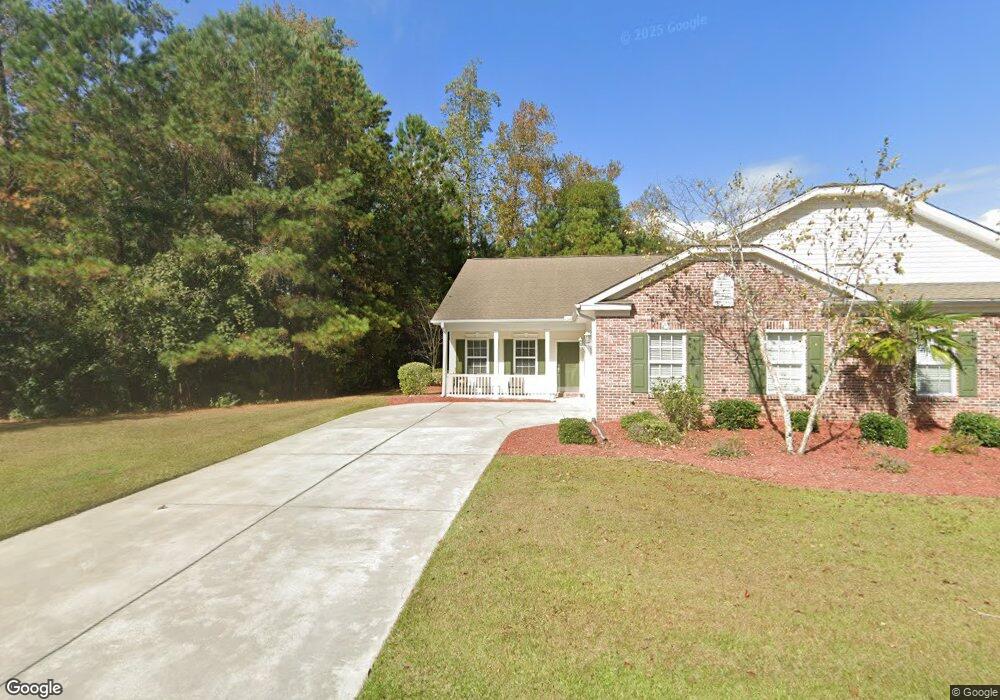
107 Rose Water Loop Myrtle Beach, SC 29588
Estimated Value: $287,000 - $331,000
2
Beds
2
Baths
1,676
Sq Ft
$182/Sq Ft
Est. Value
About This Home
This home is located at 107 Rose Water Loop, Myrtle Beach, SC 29588 and is currently estimated at $305,238, approximately $182 per square foot. 107 Rose Water Loop is a home located in Horry County with nearby schools including Burgess Elementary School, St. James Intermediate, and St. James High School.
Ownership History
Date
Name
Owned For
Owner Type
Purchase Details
Closed on
Dec 9, 2013
Sold by
Grand Strand Investments Llc
Bought by
Palermo Thomas V
Current Estimated Value
Purchase Details
Closed on
Jul 11, 2013
Sold by
Master In Equity Horry County
Bought by
Grand Strand Investments Llc
Purchase Details
Closed on
Sep 23, 2011
Sold by
Master In Equity Horry County
Bought by
Riverbend Community Association Inc
Purchase Details
Closed on
Jul 24, 2007
Sold by
Portrait Homes River Bend Llc
Bought by
Kalemba Catherine E and Hilmers Robert L
Home Financials for this Owner
Home Financials are based on the most recent Mortgage that was taken out on this home.
Original Mortgage
$30,562
Interest Rate
6.63%
Mortgage Type
Credit Line Revolving
Create a Home Valuation Report for This Property
The Home Valuation Report is an in-depth analysis detailing your home's value as well as a comparison with similar homes in the area
Home Values in the Area
Average Home Value in this Area
Purchase History
| Date | Buyer | Sale Price | Title Company |
|---|---|---|---|
| Palermo Thomas V | $125,000 | -- | |
| Palermo Thomas V | $125,000 | -- | |
| Grand Strand Investments Llc | $111,000 | -- | |
| Riverbend Community Association Inc | $6,000 | -- | |
| Kalemba Catherine E | $203,749 | None Available |
Source: Public Records
Mortgage History
| Date | Status | Borrower | Loan Amount |
|---|---|---|---|
| Previous Owner | Kalemba Catherine E | $30,562 | |
| Previous Owner | Kalemba Catherine E | $162,999 |
Source: Public Records
Tax History
| Year | Tax Paid | Tax Assessment Tax Assessment Total Assessment is a certain percentage of the fair market value that is determined by local assessors to be the total taxable value of land and additions on the property. | Land | Improvement |
|---|---|---|---|---|
| 2025 | $801 | $0 | $0 | $0 |
| 2024 | $801 | $11,865 | $2,645 | $9,220 |
| 2023 | $801 | $6,729 | $1,149 | $5,580 |
| 2021 | $726 | $10,909 | $2,167 | $8,742 |
| 2020 | $630 | $10,909 | $2,167 | $8,742 |
| 2019 | $630 | $10,909 | $2,167 | $8,742 |
| 2018 | $569 | $8,777 | $1,487 | $7,290 |
| 2017 | $554 | $8,777 | $1,487 | $7,290 |
| 2016 | -- | $8,777 | $1,487 | $7,290 |
| 2015 | $564 | $15,360 | $2,602 | $12,758 |
| 2014 | $522 | $8,777 | $1,487 | $7,290 |
Source: Public Records
Map
Nearby Homes
- 325 River Run Dr Unit 325 River Run Drive
- 401 Rustic Ct
- 520 Riverward Dr Unit 520
- 528 Riverward Dr Unit 528
- 216 Rose Water Loop
- 854 Riverward Dr
- 152 Rose Water Loop
- 839 Riverward Dr
- 706 Riverward Dr
- 184 Rose Water Loop
- 638 Riverward Dr
- 765 Riverward Dr
- 723 Riverward Dr Unit 723
- 621 Riverward Dr Unit 621
- 783 Riverward Dr
- 292 Chamberlin Rd
- 269 Chamberlin Rd Unit 269 Chamberlin Road
- 745 Mcduffie Dr
- 720 Mcduffie Dr
- 716 Mcduffie Dr
- 107 Rose Water Loop Unit Riverbend
- 107 Rose Water Loop Unit 107
- 111 Rose Water Loop Unit 111
- 115 Rose Water Loop
- 244 Rose Water Loop
- 119 Rose Water Loop
- 240 Rose Water Loop
- 104 Rose Water Loop
- 112 Rose Water Loop
- 100 Rose Water Loop
- 116 Rose Water Loop
- 236 Rose Water Loop Unit Riverbend, Lot 205
- TBD River Run Dr
- 120 Rose Water Loop
- 509 River Run Dr
- 513 River Run Dr
- 313 River Run Dr
- 317 River Run Dr
- 517 River Run Dr
- 521 River Run Dr
Your Personal Tour Guide
Ask me questions while you tour the home.