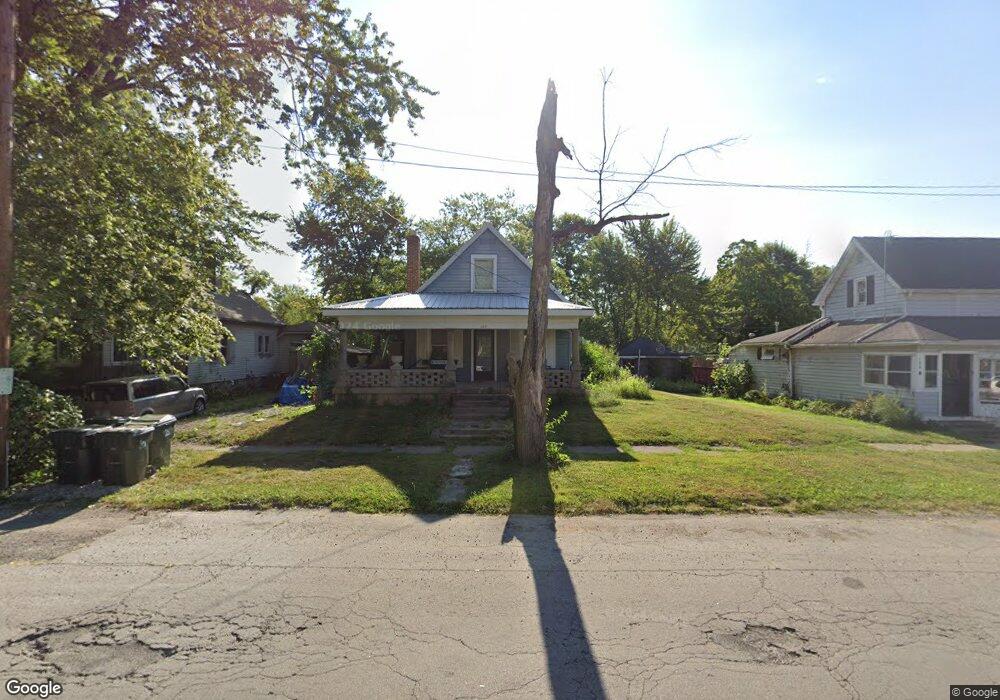
107 S Main St Carthage, IN 46115
Estimated Value: $115,000 - $161,000
3
Beds
1
Bath
1,520
Sq Ft
$92/Sq Ft
Est. Value
About This Home
This home is located at 107 S Main St, Carthage, IN 46115 and is currently estimated at $139,179, approximately $91 per square foot. 107 S Main St is a home with nearby schools including Knightstown Elementary School, Knightstown Intermediate School, and Knightstown High School.
Ownership History
Date
Name
Owned For
Owner Type
Purchase Details
Closed on
Aug 2, 2022
Sold by
Jean Elmore-Pike Annis
Bought by
Annis Jean Elmore-Pike Family Trust
Current Estimated Value
Purchase Details
Closed on
Aug 9, 2019
Sold by
House Chef Llc
Bought by
Wessel Dennis
Purchase Details
Closed on
Jul 31, 2019
Sold by
Secretary Of Housing & Urban Development
Bought by
House Chef Llc
Purchase Details
Closed on
Oct 2, 2018
Sold by
Wells Fargo Bank Na
Bought by
Secretary Of Housing & Urban Development
Purchase Details
Closed on
Sep 19, 2018
Sold by
Duncan Bradley L and Duncan Bradley
Bought by
Wells Fargo Bank Na
Purchase Details
Closed on
Dec 16, 2013
Sold by
Barron Norman G and Barron Margaret E
Bought by
Duncan Bradley L
Home Financials for this Owner
Home Financials are based on the most recent Mortgage that was taken out on this home.
Original Mortgage
$71,606
Interest Rate
4.1%
Mortgage Type
FHA
Create a Home Valuation Report for This Property
The Home Valuation Report is an in-depth analysis detailing your home's value as well as a comparison with similar homes in the area
Home Values in the Area
Average Home Value in this Area
Purchase History
| Date | Buyer | Sale Price | Title Company |
|---|---|---|---|
| Annis Jean Elmore-Pike Family Trust | -- | -- | |
| Wessel Dennis | -- | Regional First Ttl Group Llc | |
| House Chef Llc | -- | None Available | |
| Secretary Of Housing & Urban Development | -- | Boston National Ttl Agcy Llc | |
| Wells Fargo Bank Na | $58,500 | None Available | |
| Duncan Bradley L | -- | None Available |
Source: Public Records
Mortgage History
| Date | Status | Borrower | Loan Amount |
|---|---|---|---|
| Previous Owner | Duncan Bradley L | $71,606 |
Source: Public Records
Tax History Compared to Growth
Tax History
| Year | Tax Paid | Tax Assessment Tax Assessment Total Assessment is a certain percentage of the fair market value that is determined by local assessors to be the total taxable value of land and additions on the property. | Land | Improvement |
|---|---|---|---|---|
| 2024 | $1,984 | $99,200 | $23,600 | $75,600 |
| 2023 | $1,837 | $91,800 | $21,900 | $69,900 |
| 2022 | $1,689 | $84,400 | $20,100 | $64,300 |
| 2021 | $1,141 | $55,300 | $17,500 | $37,800 |
| 2020 | $1,067 | $52,200 | $16,500 | $35,700 |
| 2019 | $1,027 | $50,200 | $16,500 | $33,700 |
| 2018 | $1,287 | $63,100 | $16,500 | $46,600 |
| 2017 | $1,276 | $62,500 | $16,500 | $46,000 |
| 2016 | $1,245 | $61,100 | $16,500 | $44,600 |
| 2014 | $1,211 | $60,500 | $16,500 | $44,000 |
| 2013 | $1,211 | $60,500 | $16,500 | $44,000 |
Source: Public Records
Map
Nearby Homes
- 4 W Henley St
- 207 E Log St
- 307 Henley Ave
- 308 Winters Way
- 717 Henley Ave
- 405 E 5th St
- 726 N Main St
- 6053 N 800 W
- 5854 N 800 W
- 11020 W Us Highway 40
- 263 S Carthage Rd
- 308 S West St
- 225 S Carthage Rd
- 132 S East St
- 315 Blue River Dr
- 306 Blue River Dr
- 308 Blue River Dr
- 324 Blue River Dr
- 307 Blue River Dr
- 151 S Madison St