Estimated Value: $112,000 - $124,995
4
Beds
2
Baths
1,248
Sq Ft
$93/Sq Ft
Est. Value
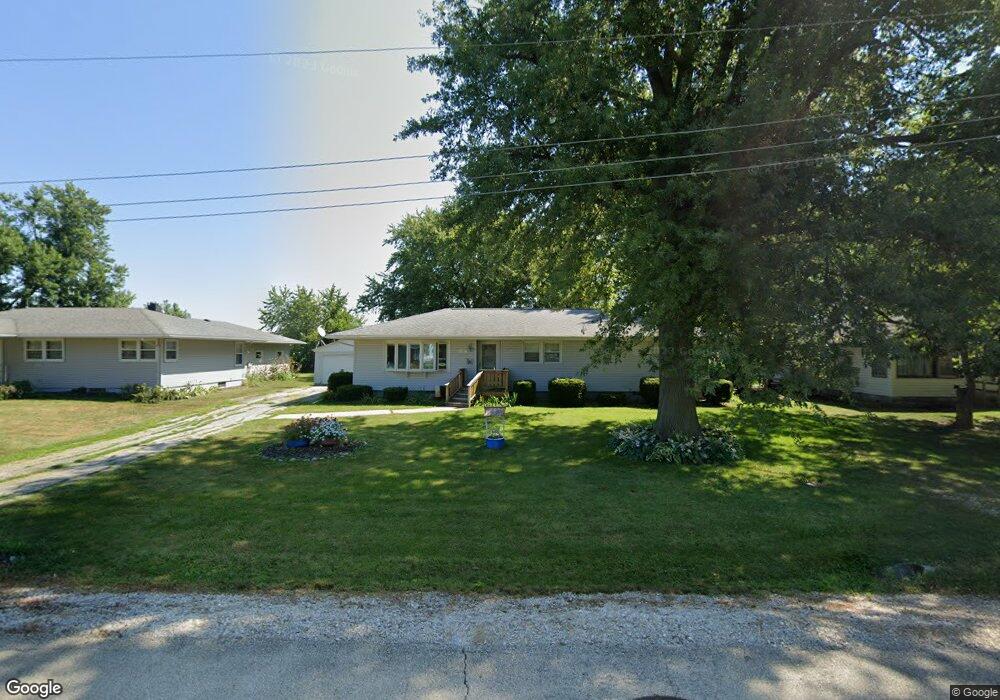
About This Home
This home is located at 107 S Yates St, Alpha, IL 61413 and is currently estimated at $116,499, approximately $93 per square foot. 107 S Yates St is a home located in Henry County with nearby schools including Alwood Elementary School and Alwood Middle/High School.
Ownership History
Date
Name
Owned For
Owner Type
Purchase Details
Closed on
Feb 7, 2011
Sold by
U S Bank National Association
Bought by
Sage Richard L and Sage Claudia M
Current Estimated Value
Home Financials for this Owner
Home Financials are based on the most recent Mortgage that was taken out on this home.
Original Mortgage
$22,500
Interest Rate
6.5%
Mortgage Type
Future Advance Clause Open End Mortgage
Purchase Details
Closed on
Aug 3, 2010
Sold by
Miner Randall D and Miner Randall
Bought by
U S Bank National Association
Purchase Details
Closed on
Nov 7, 2005
Sold by
Secretary Of Veterans Affairs
Bought by
Miner Randall and Miner Tammy
Home Financials for this Owner
Home Financials are based on the most recent Mortgage that was taken out on this home.
Original Mortgage
$15,000
Interest Rate
5.61%
Mortgage Type
Stand Alone Second
Purchase Details
Closed on
Jun 20, 2005
Sold by
Peden Todd W and Peden Penny S
Bought by
The Secretary Of Hud
Create a Home Valuation Report for This Property
The Home Valuation Report is an in-depth analysis detailing your home's value as well as a comparison with similar homes in the area
Purchase History
| Date | Buyer | Sale Price | Title Company |
|---|---|---|---|
| Sage Richard L | $30,000 | None Available | |
| U S Bank National Association | -- | None Available | |
| Miner Randall | -- | None Available | |
| The Secretary Of Hud | -- | None Available |
Source: Public Records
Mortgage History
| Date | Status | Borrower | Loan Amount |
|---|---|---|---|
| Closed | Sage Richard L | $22,500 | |
| Previous Owner | Miner Randall | $15,000 |
Source: Public Records
Tax History
| Year | Tax Paid | Tax Assessment Tax Assessment Total Assessment is a certain percentage of the fair market value that is determined by local assessors to be the total taxable value of land and additions on the property. | Land | Improvement |
|---|---|---|---|---|
| 2024 | $3,089 | $37,686 | $4,843 | $32,843 |
| 2023 | $2,884 | $34,766 | $4,468 | $30,298 |
| 2022 | $2,660 | $32,013 | $4,114 | $27,899 |
| 2021 | $2,493 | $29,641 | $3,809 | $25,832 |
| 2020 | $2,432 | $28,845 | $3,707 | $25,138 |
| 2019 | $2,406 | $28,413 | $3,651 | $24,762 |
| 2018 | $2,344 | $27,586 | $3,545 | $24,041 |
| 2017 | $2,331 | $26,861 | $3,452 | $23,409 |
| 2016 | $2,334 | $26,728 | $3,435 | $23,293 |
| 2015 | $1,350 | $26,728 | $3,435 | $23,293 |
| 2013 | $1,350 | $26,998 | $3,470 | $23,528 |
Source: Public Records
Map
Nearby Homes
- 108 S Yates St
- 592 Lake Dr
- 36 Illinois 17
- 353 E 4th Ave
- 506 State St
- 393 E 5th St
- 217 N 5th Ave
- 462 Knoxville Trail
- 500 N 7th Ave
- 1117 Franklin St
- 302 Coeburg St
- 3344 148th Ave
- 8813 Co Hwy 9
- 409 Mckillop St
- Lot 2 Shepherd Dr
- Lot 13 Shepherd Dr
- Lot 3 Shepherd Dr
- Lot 12 Shepherd Dr
- Lot 4 Shepherd Dr
- Lot 5 Shepherd Dr
Your Personal Tour Guide
Ask me questions while you tour the home.