Estimated Value: $112,000 - $173,000
--
Bed
1
Bath
1,125
Sq Ft
$118/Sq Ft
Est. Value
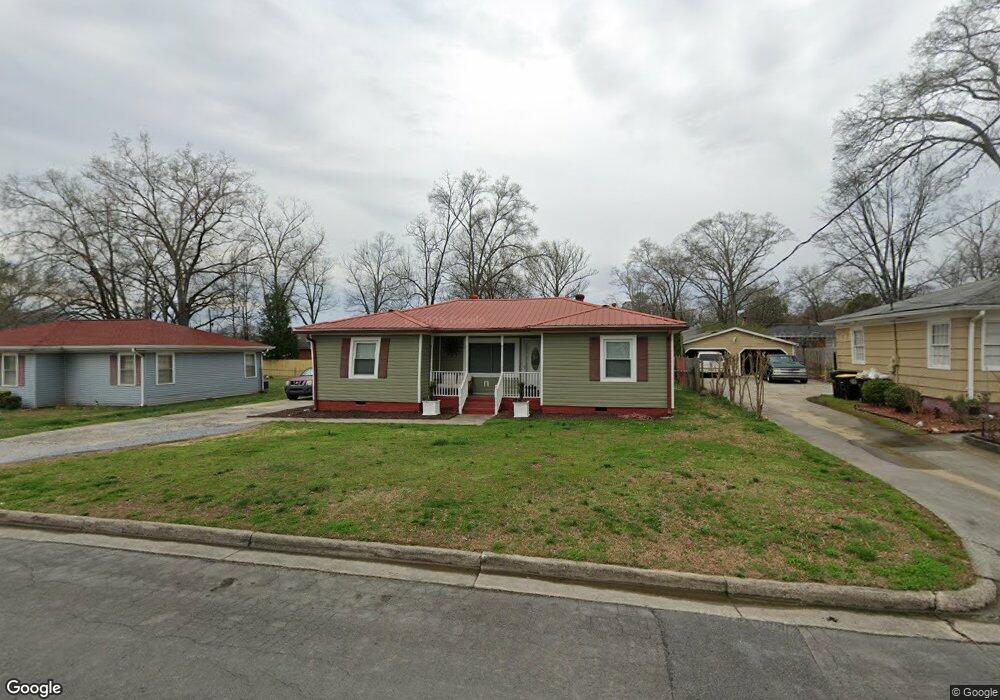
About This Home
This home is located at 107 Sheridan Dr NW, Rome, GA 30165 and is currently estimated at $132,498, approximately $117 per square foot. 107 Sheridan Dr NW is a home located in Floyd County with nearby schools including Rome High School and St. Mary School.
Ownership History
Date
Name
Owned For
Owner Type
Purchase Details
Closed on
Apr 28, 2000
Sold by
Braden Larry
Bought by
Gonzales Saul
Current Estimated Value
Purchase Details
Closed on
Dec 4, 1997
Sold by
Kadel Mrs Clara L
Bought by
Braden Larry
Purchase Details
Closed on
Aug 11, 1978
Sold by
Mcwhorter Robert H
Bought by
Kadel Mrs Clara L
Purchase Details
Closed on
Jan 28, 1976
Sold by
Leming Marjorie D
Bought by
Mcwhorter Robert H
Purchase Details
Closed on
Dec 9, 1968
Sold by
Leming Ernest Harbin and Leming Marjorie D
Bought by
Leming Marjorie D
Purchase Details
Closed on
Jun 22, 1965
Sold by
Cook Bessie C
Bought by
Leming Ernest Harbin and Leming Marjorie D
Purchase Details
Closed on
Jun 18, 1964
Sold by
Synder W M
Bought by
Cook Bessie C
Purchase Details
Closed on
Jan 1, 1962
Sold by
Ramsaur John
Bought by
Synder W M
Purchase Details
Closed on
Jan 1, 1901
Bought by
Ramsaur John
Create a Home Valuation Report for This Property
The Home Valuation Report is an in-depth analysis detailing your home's value as well as a comparison with similar homes in the area
Home Values in the Area
Average Home Value in this Area
Purchase History
| Date | Buyer | Sale Price | Title Company |
|---|---|---|---|
| Gonzales Saul | $65,300 | -- | |
| Braden Larry | $60,400 | -- | |
| Kadel Mrs Clara L | $24,500 | -- | |
| Mcwhorter Robert H | $22,900 | -- | |
| Leming Marjorie D | -- | -- | |
| Leming Ernest Harbin | $11,000 | -- | |
| Cook Bessie C | $11,000 | -- | |
| Synder W M | -- | -- | |
| Ramsaur John | -- | -- |
Source: Public Records
Tax History Compared to Growth
Tax History
| Year | Tax Paid | Tax Assessment Tax Assessment Total Assessment is a certain percentage of the fair market value that is determined by local assessors to be the total taxable value of land and additions on the property. | Land | Improvement |
|---|---|---|---|---|
| 2024 | $1,704 | $43,704 | $11,232 | $32,472 |
| 2023 | $1,548 | $41,153 | $10,080 | $31,073 |
| 2022 | $1,233 | $33,802 | $8,352 | $25,450 |
| 2021 | $1,149 | $30,977 | $8,352 | $22,625 |
| 2020 | $1,031 | $27,562 | $6,336 | $21,226 |
| 2019 | $967 | $26,136 | $6,336 | $19,800 |
| 2018 | $916 | $24,737 | $6,336 | $18,401 |
| 2017 | $885 | $23,892 | $6,336 | $17,556 |
| 2016 | $849 | $22,873 | $6,320 | $16,553 |
| 2015 | $802 | $22,873 | $6,320 | $16,553 |
| 2014 | $802 | $22,873 | $6,320 | $16,553 |
Source: Public Records
Map
Nearby Homes
- 23 Sweetspire Dr NW
- 21 Sweetspire Dr NW
- 124 Sheridan Dr NW
- 8 S Hughes St SW
- 8 Leon St SW
- 4 Homestead Cir NW
- 100 Dellwood Dr NW
- 808 Charlton St NW
- 3 Berckman Ln SW
- 50 Melton Ave SW
- 14 Berckman Ln SW
- 17 Rosewood Rd SW
- 0 Mount Alto Rd SW Unit 10523740
- 40 Paris Dr SW
- 13 Ridgewood Rd SW
- 19 Berckman Ln SW
- 15 Alexander St
- 3 Pebble Bend Ct
- 110 Williamson St SW
- 109 Sheridan Dr NW
- 105 Sheridan Dr NW
- 6 Lawton St NW
- 4 Lawton St NW
- 103 Sheridan Dr NW
- 111 Sheridan Dr NW
- 8 Lawton St NW
- 2 Lawton St NW
- 108 Sheridan Dr NW
- 110 Sheridan Dr NW
- 113 Sheridan Dr NW
- 10 Lawton St NW
- 112 Sheridan Dr NW
- 0 Sheridan Dr NW Unit 7476830
- 0 Sheridan Dr NW Unit 7137008
- 0 Sheridan Dr NW Unit 8660809
- 0 Sheridan Dr NW Unit 8902246
- 0 Sheridan Dr NW Unit 8011487
- 0 Sheridan Dr NW Unit 7637141
- 0 Sheridan Dr NW Unit 2961190