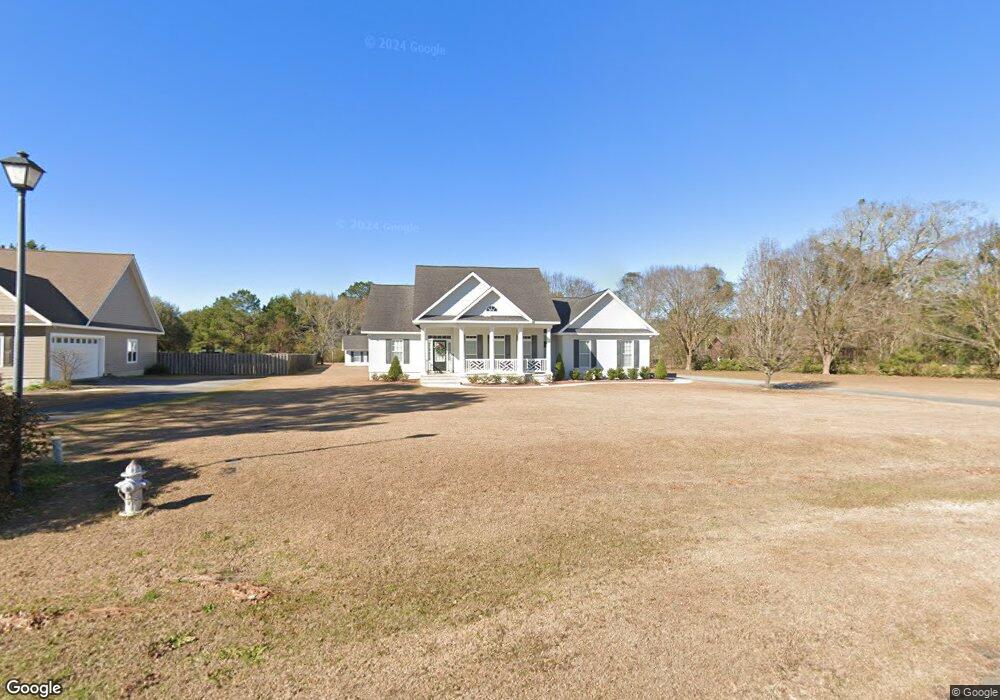
107 Slash Pine Ln N Unit Lot 5 Thomasville, GA 31757
Estimated Value: $322,188 - $358,000
3
Beds
2
Baths
1,825
Sq Ft
$184/Sq Ft
Est. Value
About This Home
This home is located at 107 Slash Pine Ln N Unit Lot 5, Thomasville, GA 31757 and is currently estimated at $336,047, approximately $184 per square foot. 107 Slash Pine Ln N Unit Lot 5 is a home located in Thomas County with nearby schools including Hand in Hand Primary School, Cross Creek Elementary School, and Garrison-Pilcher Elementary School.
Ownership History
Date
Name
Owned For
Owner Type
Purchase Details
Closed on
May 28, 2009
Sold by
Butler Donna Jean
Bought by
Butler Alex Bruce
Current Estimated Value
Purchase Details
Closed on
Jun 14, 2007
Sold by
Butler Alex B
Bought by
Butler Alex B and Butler Donna Jean
Purchase Details
Closed on
Dec 14, 2005
Sold by
Pinewood Construction Inc
Bought by
Butler Alex B
Home Financials for this Owner
Home Financials are based on the most recent Mortgage that was taken out on this home.
Original Mortgage
$140,000
Outstanding Balance
$78,284
Interest Rate
6.28%
Mortgage Type
New Conventional
Estimated Equity
$257,763
Purchase Details
Closed on
Dec 14, 2004
Sold by
Bassett Malcolm L
Bought by
Acorn Properties Inc
Purchase Details
Closed on
Sep 15, 2004
Sold by
Bassett Malcolm L
Bought by
Acorn Properties Inc
Create a Home Valuation Report for This Property
The Home Valuation Report is an in-depth analysis detailing your home's value as well as a comparison with similar homes in the area
Home Values in the Area
Average Home Value in this Area
Purchase History
| Date | Buyer | Sale Price | Title Company |
|---|---|---|---|
| Butler Alex Bruce | -- | -- | |
| Butler Alex B | -- | -- | |
| Butler Alex B | $207,000 | -- | |
| Acorn Properties Inc | -- | -- | |
| Acorn Properties Inc | $600,000 | -- |
Source: Public Records
Mortgage History
| Date | Status | Borrower | Loan Amount |
|---|---|---|---|
| Open | Butler Alex B | $140,000 |
Source: Public Records
Tax History Compared to Growth
Tax History
| Year | Tax Paid | Tax Assessment Tax Assessment Total Assessment is a certain percentage of the fair market value that is determined by local assessors to be the total taxable value of land and additions on the property. | Land | Improvement |
|---|---|---|---|---|
| 2024 | $2,426 | $119,293 | $21,736 | $97,557 |
| 2023 | $2,162 | $108,990 | $19,760 | $89,230 |
| 2022 | $2,176 | $99,508 | $17,100 | $82,408 |
| 2021 | $2,257 | $93,835 | $18,000 | $75,835 |
| 2020 | $2,212 | $89,763 | $18,000 | $71,763 |
| 2019 | $2,236 | $89,763 | $18,000 | $71,763 |
| 2018 | $2,228 | $87,680 | $18,000 | $69,680 |
| 2017 | $2,188 | $84,833 | $16,020 | $68,813 |
| 2016 | $2,138 | $82,360 | $16,020 | $66,340 |
| 2015 | $2,048 | $77,775 | $14,940 | $62,835 |
| 2014 | $2,017 | $76,305 | $14,940 | $61,365 |
| 2013 | -- | $76,305 | $14,940 | $61,365 |
Source: Public Records
Map
Nearby Homes
- 113 Lost Creek Ln
- 125 Lost Creek Ln
- 13310 N Us Hwy 319
- 148 Cypress Ln
- 0000 Sanford Road (47 83 Acres)
- 107 Andee Way
- 220 Dillon Rd (28 Acres)
- 220 Dillon Rd
- 221 Ginger Ln
- 101 Sweetbriar Lakes Dr
- 100 Sweetbriar Lakes Dr
- 3417 Hall
- 102 Palm Island Dr
- 104 Palm Island Dr
- 120 Kelon Dr
- 108 Palm Island Dr
- 110 Palm Island Dr
- 108 Kelon Dr
- 109 Jordan Dr
- 115 Jordan Dr
- 107 Slash Pine Ln N
- 105 Slash Pine Ln N Unit Lot 5
- 105 Slash Pine Ln N
- 103 Slash Pine Ln N
- 2253 Dillon Rd
- 101 Slash Pine Ln N
- 104 Heards Pond Ln
- 100 Heards Pond Ln Unit 56
- 100 Heards Pond Ln
- 106 Heards Pond Ln
- 100 Slash Pine Ln S
- 108 Heards Pond Ln
- 108 Heard's Pond Ln
- 101 Heards Pond Ln Unit 1
- 101 Heards Pond Ln
- 2315 Dillon Rd
- 102 Slash Pine Ln S
- 105 Heards Pond Ln
- 110 Heards Pond Ln
- 112 Heards Pond Ln