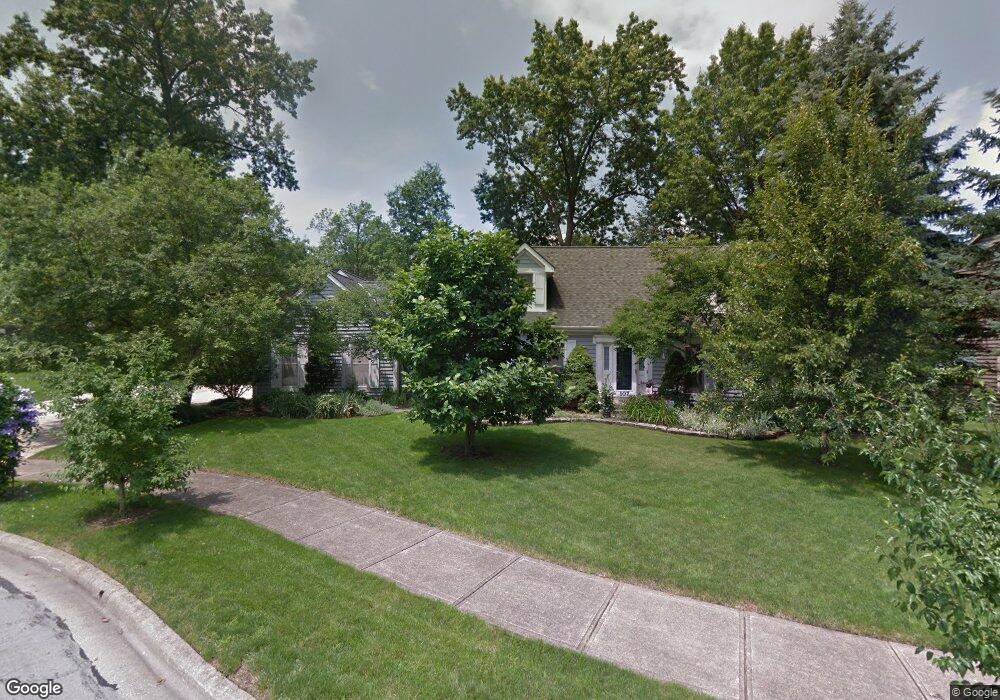
107 Springtree Ct Westerville, OH 43081
Estimated Value: $506,000 - $531,000
4
Beds
4
Baths
2,990
Sq Ft
$173/Sq Ft
Est. Value
About This Home
This home is located at 107 Springtree Ct, Westerville, OH 43081 and is currently estimated at $517,874, approximately $173 per square foot. 107 Springtree Ct is a home located in Franklin County with nearby schools including Mark Twain Elementary School, Walnut Springs Middle School, and Westerville-North High School.
Ownership History
Date
Name
Owned For
Owner Type
Purchase Details
Closed on
Feb 14, 2025
Sold by
Smolak Cheryl R
Bought by
Smolak Michael L
Current Estimated Value
Purchase Details
Closed on
Jul 27, 2007
Sold by
Chapman Alex B and Chapman Christine L
Bought by
Smolak Michael L and Smolak Cheryl R
Home Financials for this Owner
Home Financials are based on the most recent Mortgage that was taken out on this home.
Original Mortgage
$248,965
Interest Rate
6.71%
Mortgage Type
Purchase Money Mortgage
Purchase Details
Closed on
Oct 17, 2000
Sold by
Curran Amanda
Bought by
Chapman Alex B and Chapman Christine L
Home Financials for this Owner
Home Financials are based on the most recent Mortgage that was taken out on this home.
Original Mortgage
$197,000
Interest Rate
7.61%
Mortgage Type
Purchase Money Mortgage
Purchase Details
Closed on
Jun 13, 1988
Bought by
Curran Amanda
Create a Home Valuation Report for This Property
The Home Valuation Report is an in-depth analysis detailing your home's value as well as a comparison with similar homes in the area
Home Values in the Area
Average Home Value in this Area
Purchase History
| Date | Buyer | Sale Price | Title Company |
|---|---|---|---|
| Smolak Michael L | -- | None Listed On Document | |
| Smolak Michael L | $292,900 | Talon Group | |
| Chapman Alex B | $276,900 | Chicago Title West | |
| Curran Amanda | $222,000 | -- |
Source: Public Records
Mortgage History
| Date | Status | Borrower | Loan Amount |
|---|---|---|---|
| Previous Owner | Smolak Michael L | $248,965 | |
| Previous Owner | Chapman Alex B | $197,000 |
Source: Public Records
Tax History Compared to Growth
Tax History
| Year | Tax Paid | Tax Assessment Tax Assessment Total Assessment is a certain percentage of the fair market value that is determined by local assessors to be the total taxable value of land and additions on the property. | Land | Improvement |
|---|---|---|---|---|
| 2024 | $7,716 | $135,770 | $35,000 | $100,770 |
| 2023 | $7,552 | $135,765 | $35,000 | $100,765 |
| 2022 | $7,867 | $107,980 | $21,000 | $86,980 |
| 2021 | $7,933 | $107,980 | $21,000 | $86,980 |
| 2020 | $7,910 | $107,980 | $21,000 | $86,980 |
| 2019 | $6,910 | $89,040 | $17,500 | $71,540 |
| 2018 | $7,461 | $89,040 | $17,500 | $71,540 |
| 2017 | $6,795 | $89,040 | $17,500 | $71,540 |
| 2016 | $8,413 | $100,350 | $31,820 | $68,530 |
| 2015 | $8,149 | $100,350 | $31,820 | $68,530 |
| 2014 | $8,155 | $100,350 | $31,820 | $68,530 |
| 2013 | $3,879 | $95,585 | $30,310 | $65,275 |
Source: Public Records
Map
Nearby Homes
- 73 Keethler Dr S
- 974 Lakeland Dr
- 90 Spring Creek Dr
- 912 Lakeway Ct E
- 1155 Ashford Ct
- 768 Collingwood Dr
- 192 Buckeye Ct
- 1182 Lake Point
- 718 Sugar Ct
- 969 Farrington Dr
- 1368 Nutmeg Ct
- 200 Matthew Ave
- 589 E College Ave
- 150 Matthew Ave
- 182 Hillcrest Dr
- 4485 Smothers Rd
- 656 Olde Mill Dr
- 613 Valley Wood Ct
- 371 Delaware Dr
- 1146 Forest Rise Dr
- 123 Springtree Ct
- 104 Keethler Dr N
- 101 Springtree Ct
- 128 Keethler Dr N
- 110 Springtree Ct
- 94 Keethler Dr N
- 1191 Springtree Ln
- 104 Springtree Ct
- 66 Massey Dr
- 62 Massey Dr
- 1178 Springtree Ln
- 111 Whisperwood Ct
- 109 Keethler Dr N
- 119 Keethler Dr N
- 144 Keethler Dr N
- 54 Massey Dr
- 1186 Springtree Ln
- 101 Keethler Dr N
- 129 Keethler Dr N
- 1205 Springtree Ln