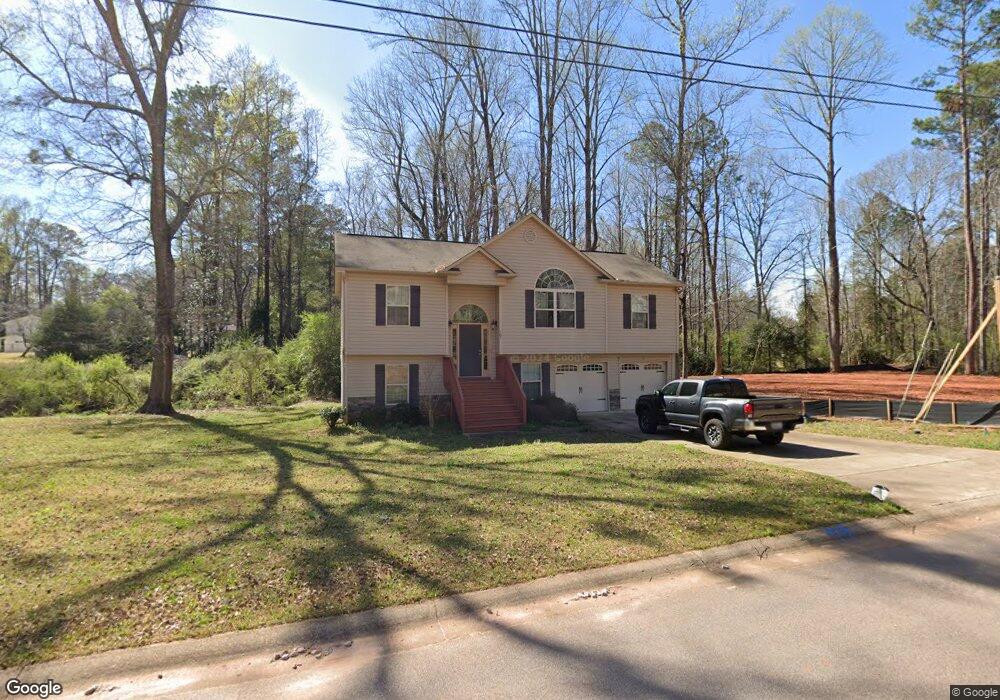
107 Starmount Dr Lagrange, GA 30241
Estimated Value: $232,000 - $295,000
5
Beds
3
Baths
1,757
Sq Ft
$147/Sq Ft
Est. Value
About This Home
This home is located at 107 Starmount Dr, Lagrange, GA 30241 and is currently estimated at $258,970, approximately $147 per square foot. 107 Starmount Dr is a home located in Troup County with nearby schools including Franklin Forest Elementary School, Hollis Hand Elementary School, and Ethel W. Kight Elementary School.
Ownership History
Date
Name
Owned For
Owner Type
Purchase Details
Closed on
May 6, 2010
Sold by
Dri Builder Inc
Bought by
Mullis Edward H
Current Estimated Value
Home Financials for this Owner
Home Financials are based on the most recent Mortgage that was taken out on this home.
Original Mortgage
$123,239
Outstanding Balance
$81,686
Interest Rate
5.06%
Mortgage Type
FHA
Estimated Equity
$177,284
Purchase Details
Closed on
Apr 30, 2010
Sold by
Dri Builder Inc
Bought by
Mullis Edward H
Home Financials for this Owner
Home Financials are based on the most recent Mortgage that was taken out on this home.
Original Mortgage
$123,239
Outstanding Balance
$81,686
Interest Rate
5.06%
Mortgage Type
FHA
Estimated Equity
$177,284
Purchase Details
Closed on
Jun 5, 2009
Sold by
Heritage Bank
Bought by
Dri Builder
Purchase Details
Closed on
May 6, 2008
Sold by
Decoteau Oneil G
Bought by
Heritage Bank
Purchase Details
Closed on
Oct 28, 2003
Sold by
Starmount Enterprises Inc
Bought by
Oneil G Decoteau
Purchase Details
Closed on
Feb 15, 2001
Bought by
Starmount Enterprises Inc
Create a Home Valuation Report for This Property
The Home Valuation Report is an in-depth analysis detailing your home's value as well as a comparison with similar homes in the area
Purchase History
| Date | Buyer | Sale Price | Title Company |
|---|---|---|---|
| Mullis Edward H | $124,900 | -- | |
| Mullis Edward H | $124,900 | -- | |
| Dri Builder | $9,000 | -- | |
| Dri Builder | $9,000 | -- | |
| Heritage Bank | $23,470 | -- | |
| Oneil G Decoteau | $20,600 | -- | |
| Starmount Enterprises Inc | -- | -- |
Source: Public Records
Mortgage History
| Date | Status | Borrower | Loan Amount |
|---|---|---|---|
| Open | Mullis Edward H | $123,239 | |
| Closed | Dri Builder | $123,239 |
Source: Public Records
Tax History
| Year | Tax Paid | Tax Assessment Tax Assessment Total Assessment is a certain percentage of the fair market value that is determined by local assessors to be the total taxable value of land and additions on the property. | Land | Improvement |
|---|---|---|---|---|
| 2025 | $2,486 | $95,560 | $10,000 | $85,560 |
| 2024 | $2,367 | $88,760 | $10,000 | $78,760 |
| 2023 | $1,963 | $73,960 | $10,000 | $63,960 |
| 2022 | $1,917 | $70,680 | $10,000 | $60,680 |
| 2021 | $1,636 | $56,240 | $8,000 | $48,240 |
| 2020 | $1,636 | $56,240 | $8,000 | $48,240 |
| 2019 | $1,617 | $55,600 | $8,000 | $47,600 |
| 2018 | $1,548 | $53,320 | $8,000 | $45,320 |
| 2017 | $1,548 | $53,320 | $8,000 | $45,320 |
| 2016 | $1,481 | $51,075 | $8,000 | $43,075 |
| 2015 | $1,490 | $51,301 | $8,000 | $43,301 |
| 2014 | $1,424 | $49,022 | $8,000 | $41,022 |
| 2013 | -- | $51,522 | $8,000 | $43,522 |
Source: Public Records
Map
Nearby Homes
- 102 Dogwood Dr
- 202 Park Hill Dr
- 203 Bonaventure Dr
- 806 New Franklin Rd
- 114 Briarcliff Rd
- 224 Rutland Cir
- 706 N Harlem Cir
- 210 Hearthstone Dr
- 900 North St
- 110 Russell St
- 204 Colonial St
- 616 S Harlem Cir
- 131 Foch St
- 87 Youngs Mill Rd
- 134 S Page St
- 219 Banks St
- 109 Thomas St
- 110 Lenox Cir
- 115 Clara Jean Ct
- 212 Cleveland Dr
- 0 Starmount Dr Unit 2064039-7682410
- 109 Starmount Dr
- 102 Starmount Dr
- 102 Starmount Dr Unit LOT 104
- 104 Starmount Dr
- 100 Starmount Dr Unit LOT 105
- 100 Starmount Dr
- 317 Laurel Ln
- 106 Starmount Dr
- 113 Starmount Dr
- 305 Valley Ct
- 321 Laurel Ln
- 301 Valley Ct
- 303 Valley Ct
- 307 Valley Ct
- 319 Laurel Ln
- 108 Starmount Dr
- 405 Somerset Place
- 331 Laurel Ln
- 205 Alton Dr
Your Personal Tour Guide
Ask me questions while you tour the home.