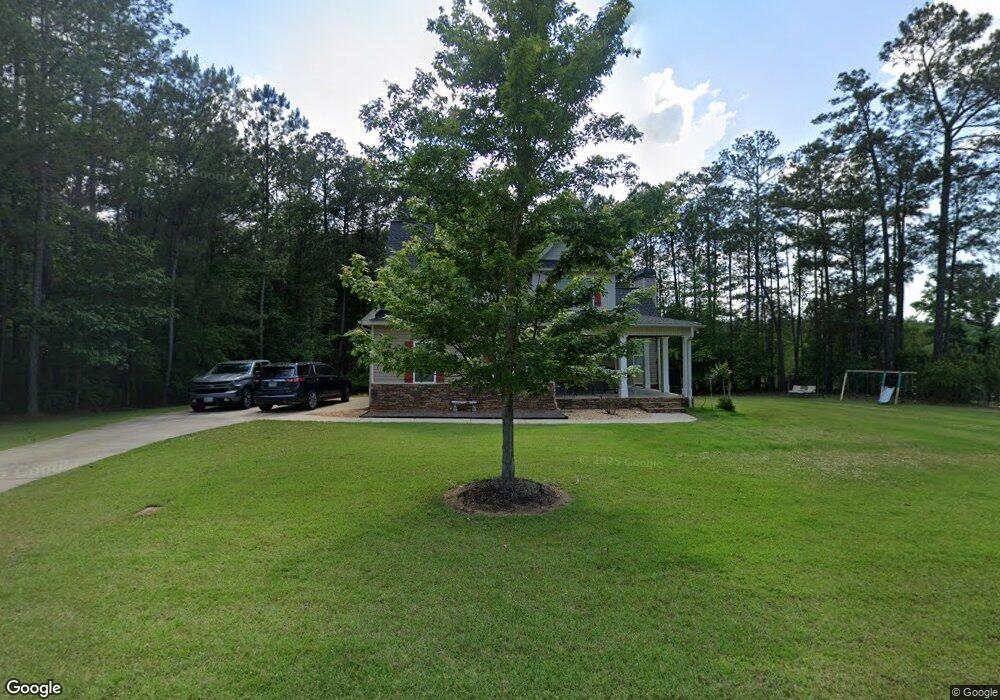
107 Stephens Point Jackson, GA 30233
Worthville NeighborhoodEstimated Value: $363,360 - $579,000
Studio
--
Bath
2,380
Sq Ft
$200/Sq Ft
Est. Value
About This Home
This home is located at 107 Stephens Point, Jackson, GA 30233 and is currently estimated at $476,340, approximately $200 per square foot. 107 Stephens Point is a home with nearby schools including Jackson High School.
Ownership History
Date
Name
Owned For
Owner Type
Purchase Details
Closed on
Sep 15, 2019
Sold by
Pierce Jeff
Bought by
Pierce Jeff B and Pierce Connie L
Current Estimated Value
Home Financials for this Owner
Home Financials are based on the most recent Mortgage that was taken out on this home.
Original Mortgage
$198,056
Outstanding Balance
$172,888
Interest Rate
3.75%
Mortgage Type
FHA
Estimated Equity
$303,452
Purchase Details
Closed on
Aug 27, 2008
Sold by
Lan Quality Homes Llc
Bought by
Pierce Jeff B
Home Financials for this Owner
Home Financials are based on the most recent Mortgage that was taken out on this home.
Original Mortgage
$217,049
Interest Rate
6.48%
Mortgage Type
FHA
Purchase Details
Closed on
Jan 25, 2008
Sold by
Not Provided
Bought by
Pierce Jeff B
Home Financials for this Owner
Home Financials are based on the most recent Mortgage that was taken out on this home.
Original Mortgage
$170,000
Interest Rate
6.17%
Mortgage Type
New Conventional
Create a Home Valuation Report for This Property
The Home Valuation Report is an in-depth analysis detailing your home's value as well as a comparison with similar homes in the area
Home Values in the Area
Average Home Value in this Area
Purchase History
| Date | Buyer | Sale Price | Title Company |
|---|---|---|---|
| Pierce Jeff B | -- | -- | |
| Pierce Jeff B | $221,000 | -- | |
| Pierce Jeff B | -- | -- |
Source: Public Records
Mortgage History
| Date | Status | Borrower | Loan Amount |
|---|---|---|---|
| Open | Pierce Jeff B | $198,056 | |
| Previous Owner | Pierce Jeff B | $217,049 | |
| Previous Owner | Pierce Jeff B | $170,000 |
Source: Public Records
Tax History
| Year | Tax Paid | Tax Assessment Tax Assessment Total Assessment is a certain percentage of the fair market value that is determined by local assessors to be the total taxable value of land and additions on the property. | Land | Improvement |
|---|---|---|---|---|
| 2025 | $3,659 | $161,478 | $14,400 | $147,078 |
| 2024 | $3,659 | $161,478 | $14,400 | $147,078 |
| 2023 | $3,849 | $149,422 | $14,400 | $135,022 |
| 2022 | $3,776 | $141,175 | $12,000 | $129,175 |
| 2021 | $3,334 | $116,766 | $12,000 | $104,766 |
| 2020 | $2,678 | $90,772 | $12,000 | $78,772 |
| 2019 | $2,359 | $82,889 | $12,000 | $70,889 |
| 2018 | $2,320 | $78,251 | $12,000 | $66,251 |
| 2017 | $2,286 | $75,792 | $12,000 | $63,792 |
| 2016 | $2,345 | $75,792 | $12,000 | $63,792 |
| 2015 | $2,312 | $75,792 | $12,000 | $63,792 |
| 2014 | -- | $71,590 | $12,000 | $59,590 |
Source: Public Records
Map
Nearby Homes
- 136 Yancey Rd
- 129 Old Kersey Rd
- 811 Barnetts Bridge Rd
- 0 Roberts Point Rd Unit 10498884
- 132 Rosebud Rd
- 210 Roberts Point Rd
- 0 Summit View Rd Unit 10687979
- 0 Summit View Rd Unit 10264510
- 0 Tussahaw Point Dr Unit 10676702
- 324 Blenny Run
- 121 Cedar Dr
- 139 Lake Pines Cir
- 141 Andrea Cir
- 110 Wilson Rd
- 0 Henry Higgins Rd Unit 10492890
- 20 Jackson Ridge Dr
- 207 Quail Trail Unit A
- 0 Bakers Cir Hall Bridge Rd Unit 10699133
- 231 Cardinal Point
- 110 River Point Rd Unit Lot 19
- 15 Jeanettes Ln Unit Lot 15
- 36 Jeanettes Ln Unit Lot 18
- 35 Jeanettes Ln Unit Lot 19
- 104 Stephens Point Unit 3
- 104 Stephens Point
- 108 Stephens Point
- 118 Stephens Point
- 403 Jackson Lake Inn Rd
- 204 Jeannettes Ln Unit LOT 13
- 37 Jeannettes Ln Unit LOT 17
- 35 Jeannettes Ln Unit LOT 19
- 13 Jeanettes Ln Unit Lot 13
- 447 Jackson Lake Inn Rd
- 203 Jeannetts Ln
- 199 Sanders Rd
- 152 Earnhart Rd
- 160 Earnhart Rd
- 144 Earnhart Rd Rd
- LOT 4 Stephens Point
- 101 Stevens Point
Your Personal Tour Guide
Ask me questions while you tour the home.