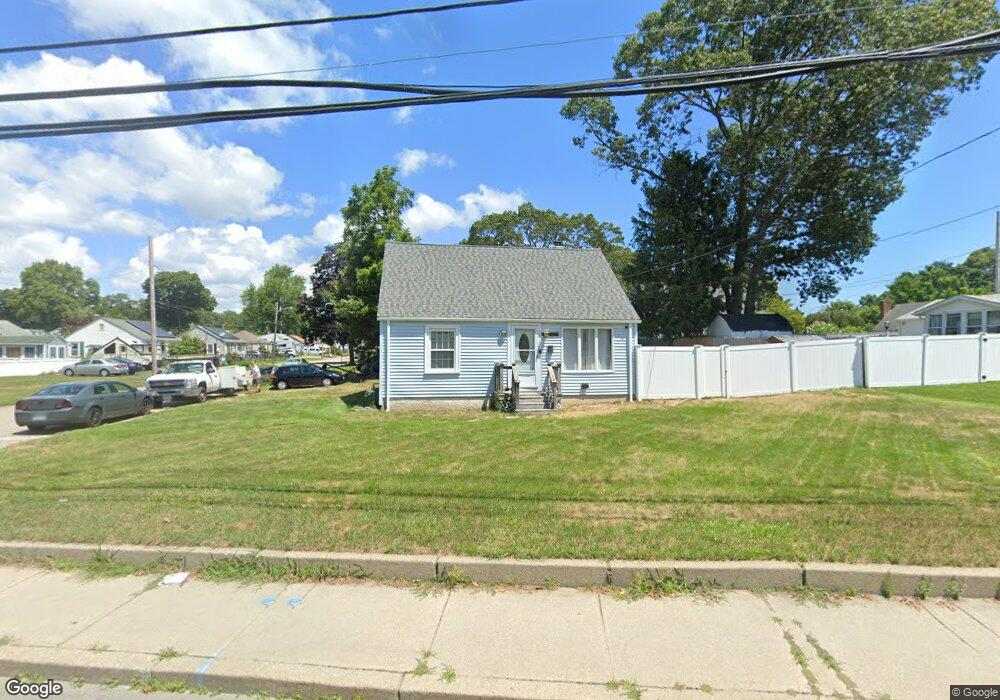
107 Strawberry Field Rd Warwick, RI 02886
Hillsgrove NeighborhoodEstimated Value: $337,884 - $371,000
3
Beds
1
Bath
1,167
Sq Ft
$301/Sq Ft
Est. Value
About This Home
This home is located at 107 Strawberry Field Rd, Warwick, RI 02886 and is currently estimated at $350,971, approximately $300 per square foot. 107 Strawberry Field Rd is a home located in Kent County with nearby schools including St Rose Of Lima School.
Ownership History
Date
Name
Owned For
Owner Type
Purchase Details
Closed on
Jun 15, 2006
Sold by
Rutherford Karen
Bought by
Belanger Thomas E and Gil Cheriann E
Current Estimated Value
Home Financials for this Owner
Home Financials are based on the most recent Mortgage that was taken out on this home.
Original Mortgage
$214,900
Outstanding Balance
$125,340
Interest Rate
6.62%
Mortgage Type
Purchase Money Mortgage
Estimated Equity
$225,631
Purchase Details
Closed on
May 28, 2004
Sold by
Thomas Kim M
Bought by
Geick Karen
Home Financials for this Owner
Home Financials are based on the most recent Mortgage that was taken out on this home.
Original Mortgage
$151,190
Interest Rate
5.88%
Mortgage Type
Purchase Money Mortgage
Purchase Details
Closed on
Feb 2, 2004
Sold by
Morriss James R
Bought by
Thomas Kim M
Home Financials for this Owner
Home Financials are based on the most recent Mortgage that was taken out on this home.
Original Mortgage
$107,900
Interest Rate
5.82%
Mortgage Type
Purchase Money Mortgage
Create a Home Valuation Report for This Property
The Home Valuation Report is an in-depth analysis detailing your home's value as well as a comparison with similar homes in the area
Home Values in the Area
Average Home Value in this Area
Purchase History
| Date | Buyer | Sale Price | Title Company |
|---|---|---|---|
| Belanger Thomas E | $215,000 | -- | |
| Geick Karen | $189,000 | -- | |
| Thomas Kim M | $134,000 | -- |
Source: Public Records
Mortgage History
| Date | Status | Borrower | Loan Amount |
|---|---|---|---|
| Open | Thomas Kim M | $214,900 | |
| Previous Owner | Thomas Kim M | $151,190 | |
| Previous Owner | Thomas Kim M | $107,900 |
Source: Public Records
Tax History Compared to Growth
Tax History
| Year | Tax Paid | Tax Assessment Tax Assessment Total Assessment is a certain percentage of the fair market value that is determined by local assessors to be the total taxable value of land and additions on the property. | Land | Improvement |
|---|---|---|---|---|
| 2025 | $3,966 | $312,300 | $102,900 | $209,400 |
| 2024 | $3,738 | $258,300 | $85,000 | $173,300 |
| 2023 | $3,665 | $258,300 | $85,000 | $173,300 |
| 2022 | $3,478 | $185,700 | $55,000 | $130,700 |
| 2021 | $3,478 | $185,700 | $55,000 | $130,700 |
| 2020 | $3,478 | $185,700 | $55,000 | $130,700 |
| 2019 | $3,478 | $185,700 | $55,000 | $130,700 |
| 2018 | $2,831 | $136,100 | $46,500 | $89,600 |
| 2017 | $2,755 | $136,100 | $46,500 | $89,600 |
| 2016 | $2,755 | $136,100 | $46,500 | $89,600 |
| 2015 | $2,760 | $133,000 | $57,000 | $76,000 |
| 2014 | $2,668 | $133,000 | $57,000 | $76,000 |
| 2013 | $2,632 | $133,000 | $57,000 | $76,000 |
Source: Public Records
Map
Nearby Homes
- 121 Hamilton Ave
- 28 Liverpool St
- 70 Turner St Unit C-6
- 53 Uphill Ave
- 64 Ormsby Ave
- 137 Dickens St
- 38 Parade Rd
- 62 Stone Ave
- 985 Cedar Swamp Rd
- 85 Union Ave
- 3 Grant St
- 288 Cove Ave
- 95 Kerri Lyn Rd
- 79 Carpenter St
- 161 Sunny Cove Dr
- 185 Brentwood Ave
- 38 Red Maple Ln
- 199 Cottage Grove Ave
- 183 Shand Ave
- 78 Keeley Ave
- 97 Strawberry Field Rd
- 146 Hamilton Ave
- 117 Strawberry Field Rd
- 211 Pinnery Ave
- 140 Hamilton Ave
- 100 Strawberry Field Rd
- 110 Strawberry Field Rd
- 143 Hamilton Ave
- 127 Strawberry Field Rd
- 201 Pinnery Ave
- 79 Strawberry Field Rd
- 134 Hamilton Ave
- 137 Hamilton Ave
- 94 Strawberry Field Rd
- 210 Pinnery Ave
- 156 Pheasant Ave
- 120 Strawberry Field Rd
- 82 Strawberry Field Rd
- 197 Pinnery Ave
- 204 Pinnery Ave