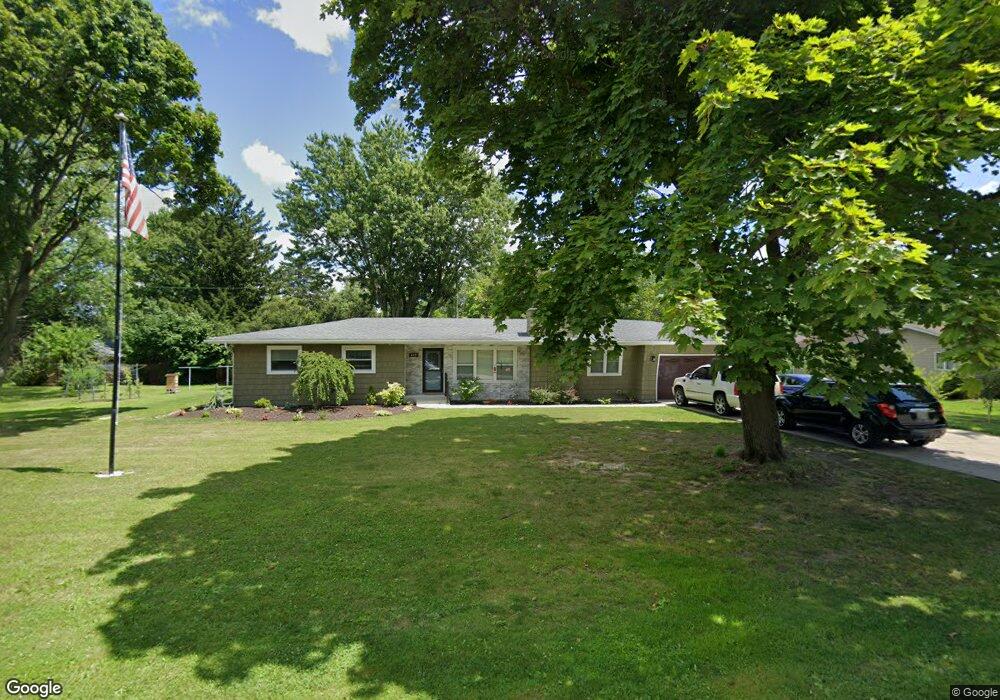
107 Taylor Dr West Unity, OH 43570
Estimated Value: $177,209 - $241,000
4
Beds
2
Baths
1,580
Sq Ft
$125/Sq Ft
Est. Value
About This Home
This home is located at 107 Taylor Dr, West Unity, OH 43570 and is currently estimated at $197,052, approximately $124 per square foot. 107 Taylor Dr is a home located in Williams County with nearby schools including Hilltop Elementary School and Hilltop High School.
Ownership History
Date
Name
Owned For
Owner Type
Purchase Details
Closed on
Oct 8, 2021
Sold by
Beck Ronald Pete and Beck Brenda S
Bought by
Beck Ronald Pete and Beck Brenda S
Current Estimated Value
Purchase Details
Closed on
Oct 6, 2006
Sold by
Klingler Howard and Klingler Marian
Bought by
Beck Ronald Pete and Beck Brenda S
Home Financials for this Owner
Home Financials are based on the most recent Mortgage that was taken out on this home.
Original Mortgage
$24,000
Interest Rate
6.5%
Mortgage Type
Purchase Money Mortgage
Purchase Details
Closed on
Sep 30, 1996
Sold by
Wasnich Olen Lavere And
Bought by
Wasnich Marian
Purchase Details
Closed on
Oct 3, 1991
Bought by
Wasnich Olen Lavere And
Create a Home Valuation Report for This Property
The Home Valuation Report is an in-depth analysis detailing your home's value as well as a comparison with similar homes in the area
Purchase History
| Date | Buyer | Sale Price | Title Company |
|---|---|---|---|
| Beck Ronald Pete | -- | None Listed On Document | |
| Beck Ronald Pete | $129,900 | None Available | |
| Wasnich Marian | -- | -- | |
| Wasnich Olen Lavere And | $75,000 | -- |
Source: Public Records
Mortgage History
| Date | Status | Borrower | Loan Amount |
|---|---|---|---|
| Previous Owner | Beck Ronald Pete | $24,000 |
Source: Public Records
Tax History
| Year | Tax Paid | Tax Assessment Tax Assessment Total Assessment is a certain percentage of the fair market value that is determined by local assessors to be the total taxable value of land and additions on the property. | Land | Improvement |
|---|---|---|---|---|
| 2025 | $2,216 | $54,920 | $10,330 | $44,590 |
| 2024 | $2,216 | $54,920 | $10,330 | $44,590 |
| 2023 | $2,254 | $43,580 | $10,430 | $33,150 |
| 2022 | $2,126 | $43,580 | $10,430 | $33,150 |
| 2021 | $2,073 | $43,580 | $10,430 | $33,150 |
| 2020 | $1,835 | $37,250 | $8,930 | $28,320 |
| 2019 | $1,807 | $37,250 | $8,930 | $28,320 |
| 2018 | $1,713 | $37,250 | $8,930 | $28,320 |
| 2017 | $1,675 | $34,230 | $8,470 | $25,760 |
| 2016 | $1,599 | $34,230 | $8,470 | $25,760 |
| 2015 | $1,832 | $34,230 | $8,470 | $25,760 |
| 2014 | $1,832 | $36,060 | $8,930 | $27,130 |
| 2013 | $1,801 | $36,060 | $8,930 | $27,130 |
Source: Public Records
Map
Nearby Homes
- 613 W Jackson St
- 502 N Lincoln St
- 000 W Jackson
- 106 W Catherine St
- 902 E Church St
- 22227 Us Highway 20a
- 20095 County Road H50
- 8520 County Road 16
- 8520 Williams County Road 16
- 14640 U S 20a
- 10918 Ohio 15
- 0 St Rt 15 Unit 10001011
- 301 Horton St
- 0 US Highway 20a
- 16299 County Road F75
- 200 Tyler Ln
- 302 Tyler Ln
- 23161 County Road Jk
- 17738 County Rd E
- 14857 U S 20
Your Personal Tour Guide
Ask me questions while you tour the home.