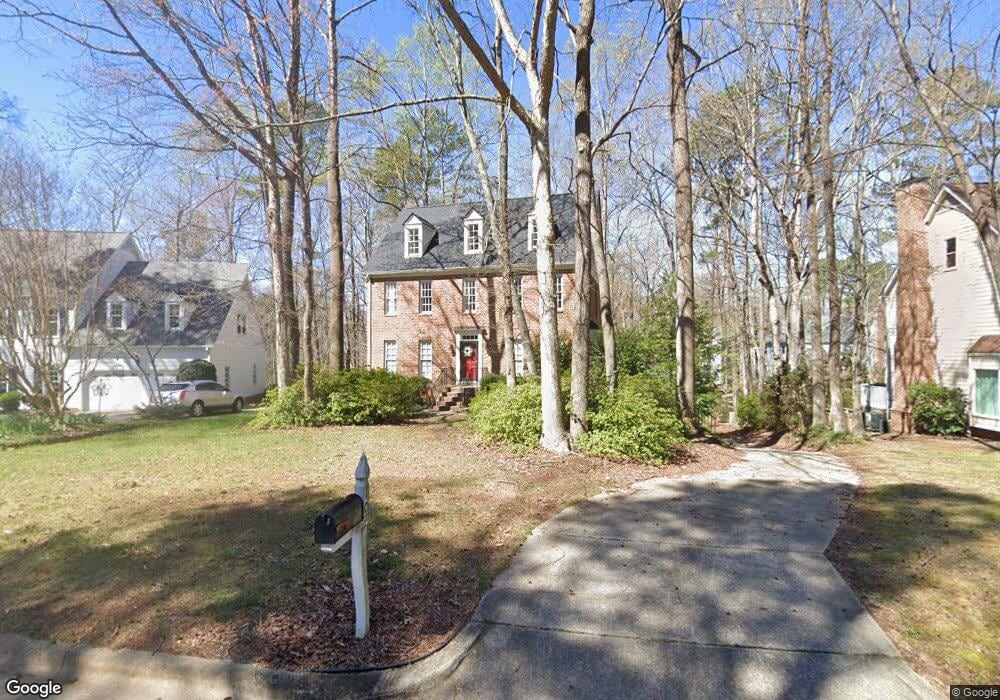
107 Thornewood Dr Cary, NC 27518
South Cary NeighborhoodEstimated Value: $756,000 - $784,000
4
Beds
3
Baths
3,216
Sq Ft
$240/Sq Ft
Est. Value
About This Home
This home is located at 107 Thornewood Dr, Cary, NC 27518 and is currently estimated at $772,701, approximately $240 per square foot. 107 Thornewood Dr is a home located in Wake County with nearby schools including Dillard Drive Magnet Elementary School, Dillard Drive Magnet Middle School, and TMSA Triangle - Triangle Math and Science Academy.
Ownership History
Date
Name
Owned For
Owner Type
Purchase Details
Closed on
Nov 24, 2014
Sold by
Barlow Randall Patrick
Bought by
Barlow Randall Patrick and Barlow Lianna M
Current Estimated Value
Purchase Details
Closed on
May 31, 2013
Sold by
Henes Robert James and Henes Laurie Anne
Bought by
Barlow Randall Patrick
Home Financials for this Owner
Home Financials are based on the most recent Mortgage that was taken out on this home.
Original Mortgage
$310,000
Outstanding Balance
$219,827
Interest Rate
3.42%
Mortgage Type
New Conventional
Estimated Equity
$552,874
Purchase Details
Closed on
Jun 29, 1998
Sold by
Calvert Mark S
Bought by
Henes Robert James and Henes Laurie Ann
Home Financials for this Owner
Home Financials are based on the most recent Mortgage that was taken out on this home.
Original Mortgage
$140,000
Interest Rate
7.21%
Create a Home Valuation Report for This Property
The Home Valuation Report is an in-depth analysis detailing your home's value as well as a comparison with similar homes in the area
Home Values in the Area
Average Home Value in this Area
Purchase History
| Date | Buyer | Sale Price | Title Company |
|---|---|---|---|
| Barlow Randall Patrick | -- | None Available | |
| Barlow Randall Patrick | $355,000 | None Available | |
| Henes Robert James | $245,000 | -- |
Source: Public Records
Mortgage History
| Date | Status | Borrower | Loan Amount |
|---|---|---|---|
| Open | Barlow Randall Patrick | $310,000 | |
| Previous Owner | Henes Robert James | $140,000 |
Source: Public Records
Tax History Compared to Growth
Tax History
| Year | Tax Paid | Tax Assessment Tax Assessment Total Assessment is a certain percentage of the fair market value that is determined by local assessors to be the total taxable value of land and additions on the property. | Land | Improvement |
|---|---|---|---|---|
| 2025 | $5,224 | $607,158 | $225,000 | $382,158 |
| 2024 | $5,111 | $607,158 | $225,000 | $382,158 |
| 2023 | $4,076 | $404,770 | $133,000 | $271,770 |
| 2022 | $3,924 | $404,770 | $133,000 | $271,770 |
| 2021 | $3,845 | $404,770 | $133,000 | $271,770 |
| 2020 | $3,865 | $404,770 | $133,000 | $271,770 |
| 2019 | $3,867 | $359,262 | $138,000 | $221,262 |
| 2018 | $3,628 | $359,262 | $138,000 | $221,262 |
| 2017 | $3,487 | $359,262 | $138,000 | $221,262 |
| 2016 | $3,435 | $359,262 | $138,000 | $221,262 |
| 2015 | $3,264 | $329,468 | $110,000 | $219,468 |
| 2014 | -- | $329,468 | $110,000 | $219,468 |
Source: Public Records
Map
Nearby Homes
- 101 Springbrook Place
- 512 Spring Flower Ct
- 305 Springhurst Ln
- 109 Kinnaird Ln
- 0 SE Cary Pkwy Unit 2491180
- 1510 Kildaire Farm Rd
- 301 Glen Echo Ln Unit E
- 101 Loch Haven Ln
- 105 Headlands Ln
- 101 Kramer Ct
- 100 Moray Ct
- 4311 Wellington Ridge Loop
- 311 Dunhagan Place
- 114 Loch Bend Ln
- 115 Loch Vale Ln
- 6315 Tryon Rd
- 108 Ridgepath Way
- 325 Glen Echo Ln Unit N
- 301 Dunhagan Place
- 302 Annandale Dr
- 105 Thornewood Dr
- 109 Thornewood Dr
- 111 Thornewood Dr
- 103 Thornewood Dr Unit Basement Apartment
- 103 Thornewood Dr
- 115 Thornewood Dr
- 113 Thornewood Dr
- 104 Thornewood Dr
- 101 Waxwood Ln
- 117 Thornewood Dr
- 101 Thornewood Dr
- 112 Thornewood Dr
- 106 Thornewood Dr
- 103 Waxwood Ln
- 119 Thornewood Dr
- 100 Waxwood Ln
- 120 Thornewood Dr
- 121 Thornewood Dr
- 114 Thornewood Dr
- 108 Thornewood Dr