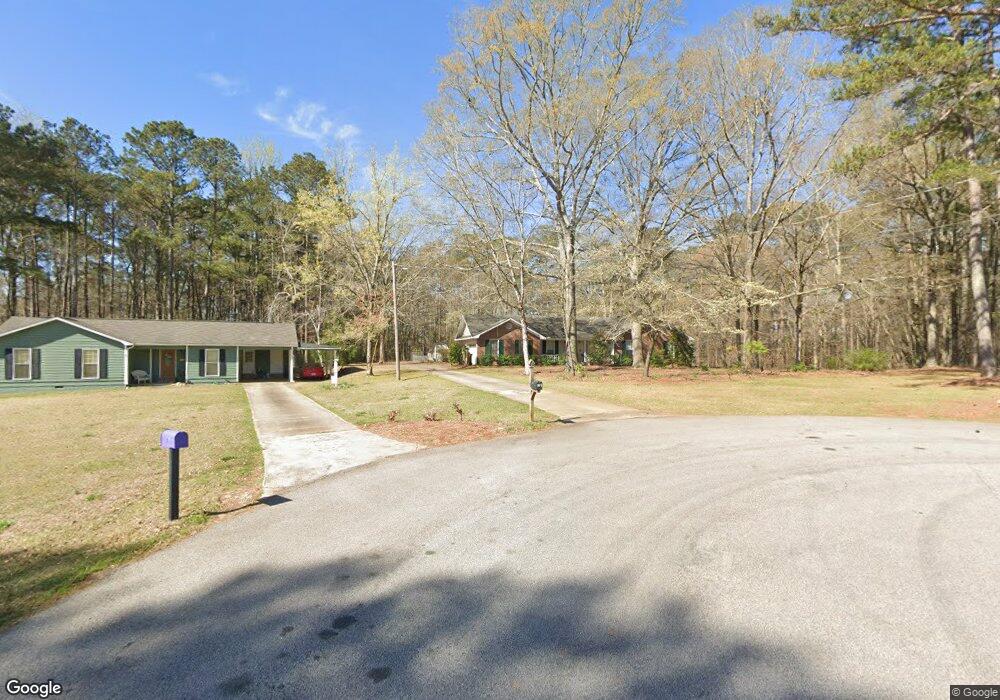
107 Vernon Ferry Ct Lagrange, GA 30240
Estimated Value: $177,000 - $254,000
3
Beds
2
Baths
1,550
Sq Ft
$146/Sq Ft
Est. Value
About This Home
This home is located at 107 Vernon Ferry Ct, Lagrange, GA 30240 and is currently estimated at $226,344, approximately $146 per square foot. 107 Vernon Ferry Ct is a home located in Troup County with nearby schools including Ethel W. Kight Elementary School, Hollis Hand Elementary School, and Franklin Forest Elementary School.
Ownership History
Date
Name
Owned For
Owner Type
Purchase Details
Closed on
Nov 16, 2001
Sold by
Kerr Benny and Kerr Nancy S
Bought by
Myers Norma G
Current Estimated Value
Purchase Details
Closed on
Jul 29, 1991
Sold by
First Federal Savins Bank Lag
Bought by
Kerr Benny and Kerr Nancy S
Purchase Details
Closed on
May 14, 1991
Sold by
Ralph Cynthia and Ralph Welborn
Bought by
First Federal Savins Bank Lag
Purchase Details
Closed on
May 17, 1990
Sold by
Ralph Lee Welborn
Bought by
Ralph Cynthia and Ralph Welborn
Purchase Details
Closed on
Sep 7, 1989
Sold by
King David P and King Virginia S
Bought by
Ralph Lee Welborn
Purchase Details
Closed on
Nov 1, 1985
Sold by
Bailey Brothers Const Company
Bought by
King David P and King Virginia S
Purchase Details
Closed on
Sep 1, 1985
Sold by
Ray W Adams
Bought by
Bailey Brothers Const Company
Purchase Details
Closed on
Jan 1, 1901
Bought by
Ray W Adams
Create a Home Valuation Report for This Property
The Home Valuation Report is an in-depth analysis detailing your home's value as well as a comparison with similar homes in the area
Purchase History
| Date | Buyer | Sale Price | Title Company |
|---|---|---|---|
| Myers Norma G | $110,500 | -- | |
| Kerr Benny | $75,000 | -- | |
| First Federal Savins Bank Lag | $74,000 | -- | |
| Ralph Cynthia | -- | -- | |
| Ralph Lee Welborn | $82,000 | -- | |
| King David P | $73,200 | -- | |
| Bailey Brothers Const Company | $9,000 | -- | |
| Ray W Adams | -- | -- |
Source: Public Records
Tax History
| Year | Tax Paid | Tax Assessment Tax Assessment Total Assessment is a certain percentage of the fair market value that is determined by local assessors to be the total taxable value of land and additions on the property. | Land | Improvement |
|---|---|---|---|---|
| 2025 | $1,127 | $73,604 | $14,000 | $59,604 |
| 2024 | $965 | $64,444 | $14,000 | $50,444 |
| 2023 | $886 | $61,524 | $10,000 | $51,524 |
| 2022 | $798 | $57,204 | $8,000 | $49,204 |
| 2021 | $638 | $49,884 | $8,000 | $41,884 |
| 2020 | $1,204 | $49,884 | $8,000 | $41,884 |
| 2019 | $1,113 | $46,852 | $8,000 | $38,852 |
| 2018 | $1,054 | $44,920 | $8,000 | $36,920 |
| 2017 | $1,054 | $44,920 | $8,000 | $36,920 |
| 2016 | $1,057 | $44,986 | $8,000 | $36,986 |
| 2015 | $824 | $37,256 | $4,800 | $32,456 |
| 2014 | $772 | $35,548 | $4,800 | $30,748 |
| 2013 | -- | $37,340 | $4,800 | $32,540 |
Source: Public Records
Map
Nearby Homes
- 709 Vernon Ferry Rd
- 213 Linda Ln
- 110 Thomas Dr
- 129 Angela East Dr
- 4.5 ACRES Whatley Rd N
- 0 Deming St Unit 10550189
- 0 Salem Rd Tract 2 Unit 10675187
- 4004 White Oak Ln
- 98 Hearn Rd
- 40 River Point Dr
- 16 River Point Dr
- 474 Newton Rd
- 113 Colonial Ct
- 101 Ivy Springs Dr
- 203 Shawnee Dr
- 311 Cumberland Dr
- 245 Teaver Rd
- 104 Independence Ct
- 104 Spring Valley Dr
- 112 Brookwood Dr
- 105 Vernon Ferry Ct
- 200 Mckinley Cir
- 108 Vernon Ferry Ct
- 103 Vernon Ferry Ct
- 108 Mckinley Cir
- 106 Vernon Ferry Ct
- 104 Vernon Ferry Ct
- 101 Vernon Ferry Ct
- 102 Vernon Ferry Ct
- 206 Mckinley Cir
- 106 Mckinley Cir
- 100 Vernon Ferry Ct
- 100 Vernon Ferry Ct
- 203 Mckinley Cir
- 201 Mckinley Cir
- 840 Vernon Ferry Rd
- 824 Vernon Ferry Rd
- 104 Mckinley Cir
- 418 Mckinley Cir
- 208 Mckinley Cir
Your Personal Tour Guide
Ask me questions while you tour the home.