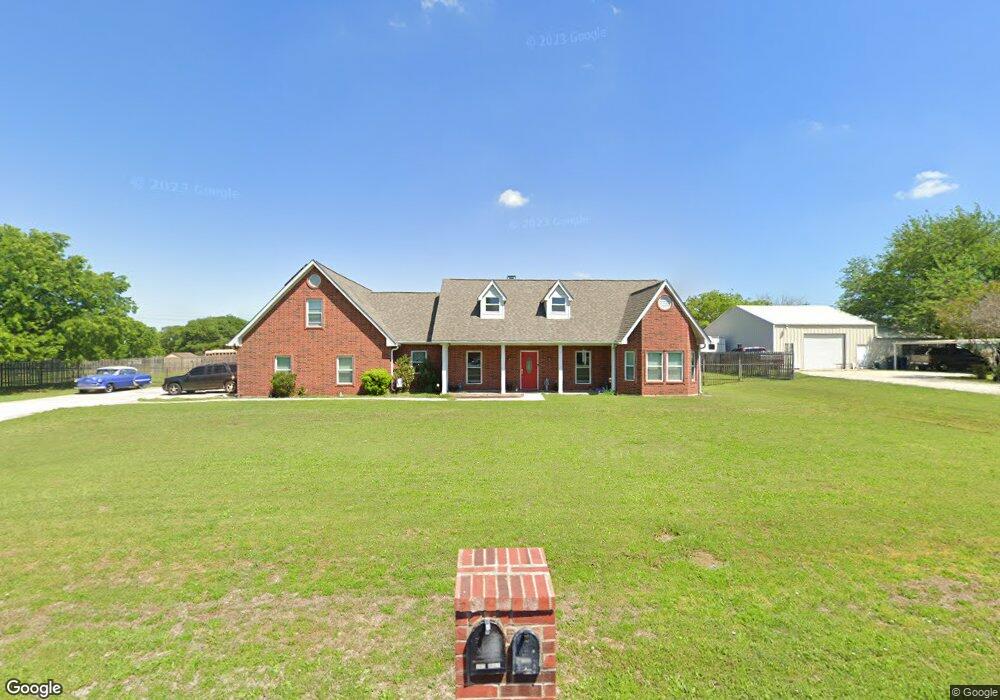
107 W Holt St Sanger, TX 76266
Estimated Value: $465,000 - $606,000
3
Beds
2
Baths
2,084
Sq Ft
$253/Sq Ft
Est. Value
About This Home
This home is located at 107 W Holt St, Sanger, TX 76266 and is currently estimated at $527,598, approximately $253 per square foot. 107 W Holt St is a home located in Denton County with nearby schools including Chisholm Trail Elementary School, Clear Creek Intermediate School, and Sanger Middle School.
Ownership History
Date
Name
Owned For
Owner Type
Purchase Details
Closed on
Mar 17, 2015
Sold by
Hill Travis Marshall
Bought by
Tadlock Robin Ashley Hill
Current Estimated Value
Purchase Details
Closed on
Nov 29, 2012
Sold by
Mcneill Mindy Ann
Bought by
Tadlock Robin Ashley
Purchase Details
Closed on
Nov 21, 2012
Sold by
Lows Custom Homes Inc
Bought by
Whisenhunt Cody
Purchase Details
Closed on
Feb 1, 2010
Sold by
Riley Jimmy Joe
Bought by
Tadlock Robin Ashley
Purchase Details
Closed on
May 22, 2008
Sold by
Whisenhunt Cody Warren
Bought by
Whisenhunt Robin Ashley
Purchase Details
Closed on
Sep 6, 2001
Sold by
Roberts Jody and Beard Ronald
Bought by
Whisenhunt Cody W
Home Financials for this Owner
Home Financials are based on the most recent Mortgage that was taken out on this home.
Original Mortgage
$120,000
Interest Rate
6.96%
Create a Home Valuation Report for This Property
The Home Valuation Report is an in-depth analysis detailing your home's value as well as a comparison with similar homes in the area
Home Values in the Area
Average Home Value in this Area
Purchase History
| Date | Buyer | Sale Price | Title Company |
|---|---|---|---|
| Tadlock Robin Ashley Hill | -- | None Available | |
| Tadlock Robin Ashley | -- | Gainesville Title Company In | |
| Whisenhunt Cody | -- | None Available | |
| Tadlock Robin Ashley | -- | None Available | |
| Whisenhunt Robin Ashley | -- | None Available | |
| Whisenhunt Cody W | -- | First American Title Co | |
| Whisenhunt Cody W | -- | First American Title Co |
Source: Public Records
Mortgage History
| Date | Status | Borrower | Loan Amount |
|---|---|---|---|
| Previous Owner | Whisenhunt Cody W | $120,000 |
Source: Public Records
Tax History Compared to Growth
Tax History
| Year | Tax Paid | Tax Assessment Tax Assessment Total Assessment is a certain percentage of the fair market value that is determined by local assessors to be the total taxable value of land and additions on the property. | Land | Improvement |
|---|---|---|---|---|
| 2025 | $7,633 | $478,329 | $174,663 | $451,116 |
| 2024 | $8,788 | $434,845 | $0 | $0 |
| 2023 | $6,854 | $395,314 | $135,849 | $410,775 |
| 2022 | $7,970 | $359,376 | $129,430 | $271,297 |
| 2021 | $6,866 | $326,705 | $58,832 | $267,873 |
| 2020 | $7,081 | $320,000 | $58,832 | $261,168 |
| 2019 | $7,507 | $329,712 | $58,832 | $270,880 |
| 2018 | $6,920 | $302,316 | $58,832 | $245,085 |
| 2017 | $6,321 | $274,833 | $58,832 | $216,001 |
| 2016 | $5,872 | $255,311 | $58,832 | $201,506 |
| 2015 | $5,025 | $232,101 | $58,832 | $173,269 |
| 2014 | $5,025 | $216,247 | $58,832 | $157,415 |
| 2013 | -- | $186,588 | $47,066 | $139,522 |
Source: Public Records
Map
Nearby Homes
- 106 W Holt St
- 411 Hughes St
- 1009 Porter Place
- 1209 Bolivar St
- 1149 Serendipity Cir
- 1010 Bolivar St
- 2037 Duck Creek Rd
- TBD Interstate 35
- 820 N Tejas Dr
- 818 N Tejas Dr
- 4063 Farm To Market 455 W
- 710 W Willow St
- 902 Plum St
- 702 Peach St Unit 2
- 2504 Santa fe Trail
- 113 Diane Dr
- 4551 Farm To Market Road 455
- 2501 Caddo Trail
- 109 S 5th St
- 509 Marshall St
- 105 W Holt St
- 109 W Holt St
- 104 W Holt St
- 111 W Holt St
- 102 W Holt St
- 789 Keaton Rd N Unit N
- 787 Keaton Rd N Unit N
- 749 Keaton Rd N Unit N
- 791 Keaton Rd N Unit N
- 793 Keaton Rd N Unit N
- 101 Berry St
- 2001 Brooke Dr
- LOT 1 I-35 Service Rd S
- 101 N Berry St
- 2003 Brooke Dr
- 2005 Brooke Dr
- 2000 Brooke Dr
- 201 N Stemmons St
- 1701 Duck Creek Rd
- 2007 Brooke Dr