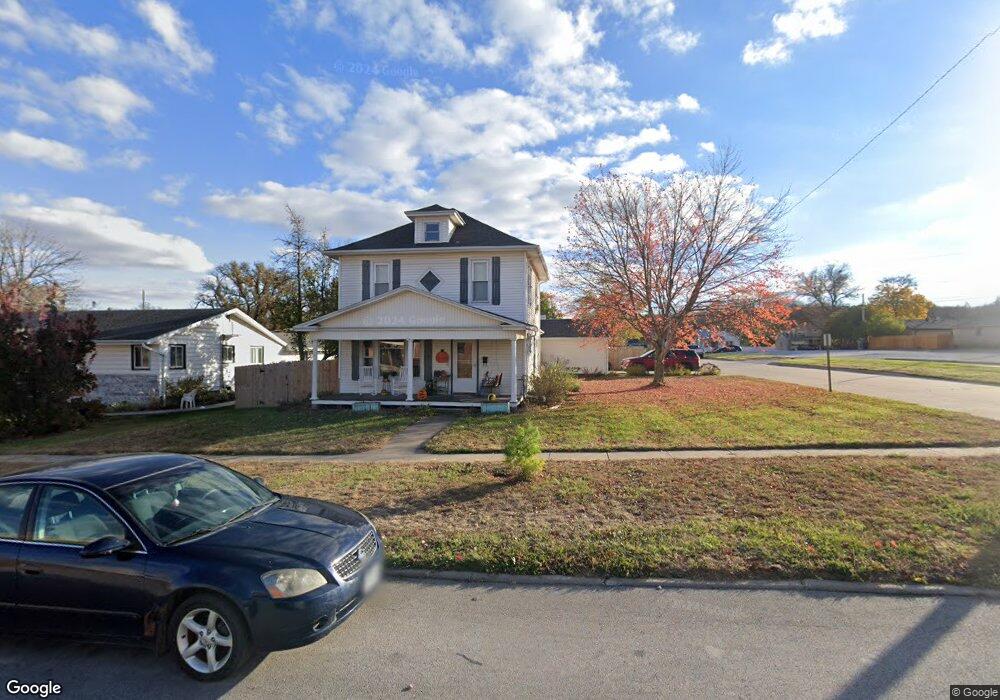
107 W O St Weeping Water, NE 68463
Estimated Value: $238,000 - $315,000
3
Beds
2
Baths
2,076
Sq Ft
$134/Sq Ft
Est. Value
About This Home
This home is located at 107 W O St, Weeping Water, NE 68463 and is currently estimated at $278,004, approximately $133 per square foot. 107 W O St is a home located in Cass County with nearby schools including Weeping Water Elementary School, Weeping Water Middle School, and Weeping Water High School.
Ownership History
Date
Name
Owned For
Owner Type
Purchase Details
Closed on
Mar 3, 2006
Sold by
Hancock Douglas Kent
Bought by
Hanneman Shawn M and Hanneman Karen J
Current Estimated Value
Home Financials for this Owner
Home Financials are based on the most recent Mortgage that was taken out on this home.
Original Mortgage
$27,910
Interest Rate
6.19%
Mortgage Type
Unknown
Purchase Details
Closed on
Feb 22, 2006
Sold by
Hancock Douglas Kend and Hancock Elgie Renee
Bought by
Hanneman Shawn M and Hanneman Karen J
Home Financials for this Owner
Home Financials are based on the most recent Mortgage that was taken out on this home.
Original Mortgage
$27,910
Interest Rate
6.19%
Mortgage Type
Unknown
Create a Home Valuation Report for This Property
The Home Valuation Report is an in-depth analysis detailing your home's value as well as a comparison with similar homes in the area
Home Values in the Area
Average Home Value in this Area
Purchase History
| Date | Buyer | Sale Price | Title Company |
|---|---|---|---|
| Hanneman Shawn M | $139,565 | -- | |
| Hanneman Shawn M | $139,565 | Capitol Title |
Source: Public Records
Mortgage History
| Date | Status | Borrower | Loan Amount |
|---|---|---|---|
| Closed | Hanneman Shawn M | $27,910 | |
| Open | Hanneman Shawn M | $111,650 | |
| Closed | Hanneman Shawn M | $27,910 | |
| Closed | Hanneman Shawn M | $111,650 |
Source: Public Records
Tax History Compared to Growth
Tax History
| Year | Tax Paid | Tax Assessment Tax Assessment Total Assessment is a certain percentage of the fair market value that is determined by local assessors to be the total taxable value of land and additions on the property. | Land | Improvement |
|---|---|---|---|---|
| 2024 | $3,473 | $214,755 | $10,630 | $204,125 |
| 2023 | $4,252 | $213,360 | $9,235 | $204,125 |
| 2022 | $3,985 | $195,841 | $9,697 | $186,144 |
| 2021 | $3,879 | $186,515 | $9,235 | $177,280 |
| 2020 | $3,403 | $158,935 | $8,297 | $150,638 |
| 2019 | $3,185 | $148,537 | $7,754 | $140,783 |
| 2018 | $3,258 | $148,537 | $7,754 | $140,783 |
| 2017 | $3,226 | $148,537 | $7,754 | $140,783 |
| 2016 | $3,182 | $148,537 | $7,754 | $140,783 |
| 2015 | $3,160 | $148,537 | $7,754 | $140,783 |
| 2014 | $3,389 | $148,537 | $7,754 | $140,783 |
Source: Public Records
Map
Nearby Homes
- 104 E O St
- 400 S Randolph St
- 104 N East St
- 300 E Eldora Ave
- 423 N Randolph St
- Lot 13, E Park St
- Lot 12, E Park St
- Lot 11, E Park St
- Lot 9, E Park St
- Lot 10, E Park St
- Lot 8, E Park St
- Lot 7, E Park St
- Lot 6, E Park St
- Lot 5, E Park St
- Lot 4, E Park St
- Lot 3, E Park St
- Lot 2, E Park St
- Lot 1, E Park St
- 303 E Park St
- Lot 1, Blk 3 Indian Dr