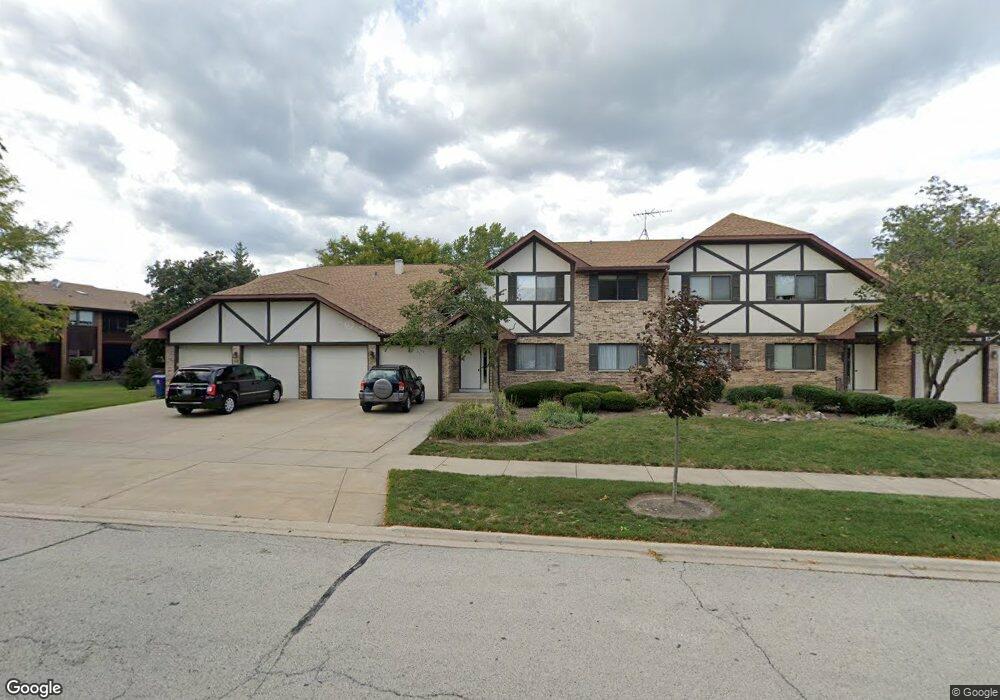
107 Walters Ln Unit 1071B Itasca, IL 60143
North Itasca NeighborhoodEstimated Value: $281,000 - $327,000
--
Bed
--
Bath
--
Sq Ft
3.8
Acres
About This Home
This home is located at 107 Walters Ln Unit 1071B, Itasca, IL 60143 and is currently estimated at $297,600. 107 Walters Ln Unit 1071B is a home located in DuPage County with nearby schools including Raymond Benson Primary School, Elmer H Franzen Intermediate School, and Cornell Elementary School.
Ownership History
Date
Name
Owned For
Owner Type
Purchase Details
Closed on
Jun 25, 2019
Sold by
Cifaldi Michael and Cifaldi Michella S
Bought by
Skenderi Helidon
Current Estimated Value
Home Financials for this Owner
Home Financials are based on the most recent Mortgage that was taken out on this home.
Original Mortgage
$203,700
Outstanding Balance
$178,739
Interest Rate
4%
Mortgage Type
New Conventional
Estimated Equity
$118,861
Purchase Details
Closed on
May 30, 2017
Sold by
Revoc Kordell Leon B
Bought by
Michelle Michael Cifaldi
Purchase Details
Closed on
Oct 8, 2015
Sold by
Kordell Leon B
Bought by
Kordell Leon B and Kordell Patricia J
Purchase Details
Closed on
Mar 22, 1999
Sold by
Cole Taylor Bank
Bought by
Kordell Leon B and Kordell Alice L
Create a Home Valuation Report for This Property
The Home Valuation Report is an in-depth analysis detailing your home's value as well as a comparison with similar homes in the area
Home Values in the Area
Average Home Value in this Area
Purchase History
| Date | Buyer | Sale Price | Title Company |
|---|---|---|---|
| Skenderi Helidon | $210,000 | Landtrust National Ttl Svcs | |
| Michelle Michael Cifaldi | $120,000 | Burnet Title | |
| Kordell Leon B | -- | Attorney | |
| Kordell Leon B | -- | -- |
Source: Public Records
Mortgage History
| Date | Status | Borrower | Loan Amount |
|---|---|---|---|
| Open | Skenderi Helidon | $203,700 |
Source: Public Records
Tax History Compared to Growth
Tax History
| Year | Tax Paid | Tax Assessment Tax Assessment Total Assessment is a certain percentage of the fair market value that is determined by local assessors to be the total taxable value of land and additions on the property. | Land | Improvement |
|---|---|---|---|---|
| 2024 | $4,738 | $76,864 | $7,288 | $69,576 |
| 2023 | $4,517 | $70,660 | $6,700 | $63,960 |
| 2022 | $4,181 | $64,570 | $6,130 | $58,440 |
| 2021 | $3,967 | $61,850 | $5,870 | $55,980 |
| 2020 | $3,807 | $59,240 | $5,620 | $53,620 |
| 2019 | $3,709 | $56,960 | $5,400 | $51,560 |
| 2018 | $3,570 | $53,590 | $5,400 | $48,190 |
| 2017 | $3,347 | $51,220 | $5,160 | $46,060 |
| 2016 | $3,159 | $47,290 | $4,760 | $42,530 |
| 2015 | $3,100 | $43,690 | $4,400 | $39,290 |
| 2014 | $3,257 | $43,690 | $4,400 | $39,290 |
| 2013 | $3,188 | $44,580 | $4,490 | $40,090 |
Source: Public Records
Map
Nearby Homes
- 201 Walters Ln Unit 2A
- 388 E Tall Oaks Ln Unit 302
- 791 Willow Ct
- 945 Willow St
- 1000 Surrey Ln
- 335 Arlington Rd
- 711 E Greenview Rd
- 29 Bay Dr
- 100 S Walnut St
- 1244 Dover Ln
- 1237 Dover Ln
- 324 Parkside Ave
- 1176 Talbots Ln Unit 914
- 260 Wellington Ave
- 206 E George St
- 909 Little Falls Ct Unit 909
- 501 Bonnie Brae Ave
- 449 Broker Ave
- 525 S Cherry St
- 101 Clearmont Dr
- 215 Walters Ln Unit 1A
- 401 Walters Ln Unit 4011A
- 401 Walters Ln Unit 2A
- 107 Walters Ln Unit 2B
- 107 Walters Ln Unit 2A
- 401 Walters Ln Unit 1B
- 215 Walters Ln Unit 215B1
- 107 Walters Ln Unit 1A
- 401 Walters Ln Unit 2B
- 215 Walters Ln Unit 2152B
- 215 Walters Ln Unit 215A2
- 107 Walters Ln Unit 1-B
- 215 Walters Ln Unit 2B
- 215 Walters Ln
- 215 Walters Ln Unit 1B
- 221 Walters Ln Unit 1B
- 301 Walters Ln Unit 1B
- 207 Walters Ln Unit 2072B
- 207 Walters Ln Unit 1B
- 113 Walters Ln Unit 1B