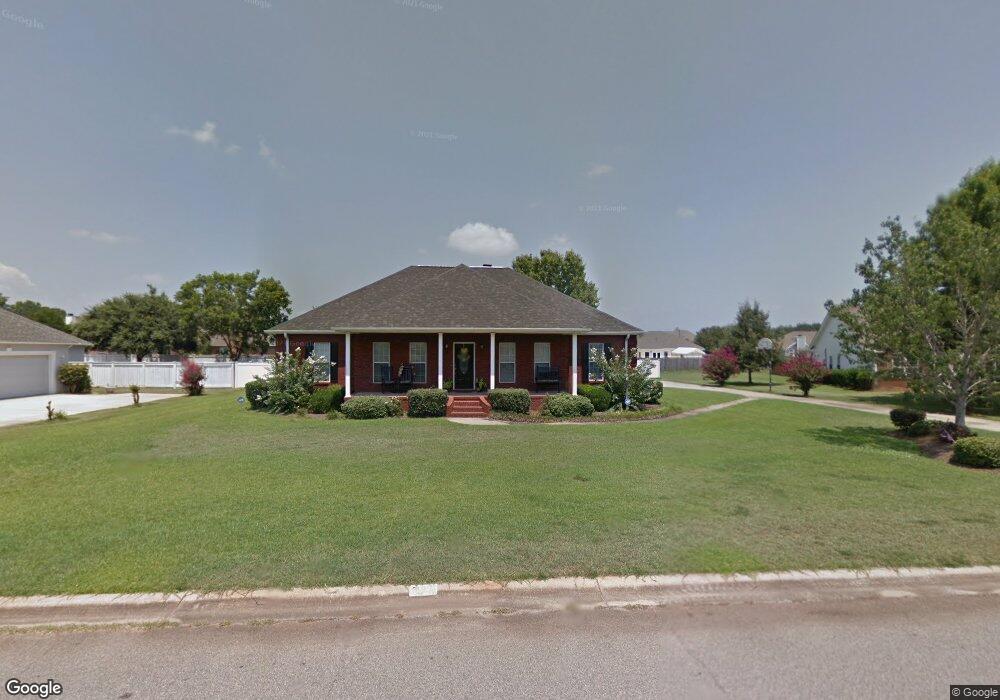
107 Wilkes Ct Warner Robins, GA 31088
Estimated Value: $278,000 - $338,000
--
Bed
1
Bath
2,402
Sq Ft
$130/Sq Ft
Est. Value
About This Home
This home is located at 107 Wilkes Ct, Warner Robins, GA 31088 and is currently estimated at $311,672, approximately $129 per square foot. 107 Wilkes Ct is a home located in Houston County with nearby schools including David A. Perdue Primary School, David A. Perdue Elementary School, and Feagin Mill Middle School.
Ownership History
Date
Name
Owned For
Owner Type
Purchase Details
Closed on
Nov 20, 2008
Sold by
Arrington Richard L
Bought by
Arrington Sharion N
Current Estimated Value
Home Financials for this Owner
Home Financials are based on the most recent Mortgage that was taken out on this home.
Original Mortgage
$90,000
Outstanding Balance
$60,320
Interest Rate
6.51%
Mortgage Type
Purchase Money Mortgage
Estimated Equity
$251,352
Purchase Details
Closed on
Jan 26, 1996
Sold by
Hunnicutt Builders Inc
Bought by
Arrington Richard L and Sharion N*
Purchase Details
Closed on
Jan 25, 1996
Sold by
Arrington Richard Lee and Arrington Sharion N
Bought by
Hunnicutt Builders Inc
Purchase Details
Closed on
Sep 5, 1995
Sold by
Arrington Richard L and Arrington Sharion N
Bought by
Hunnicutt Builders Inc
Purchase Details
Closed on
Jan 4, 1995
Sold by
Franklin Sammy W and Wilson Billy
Bought by
Arrington Richard Lee and Sharion N*
Create a Home Valuation Report for This Property
The Home Valuation Report is an in-depth analysis detailing your home's value as well as a comparison with similar homes in the area
Home Values in the Area
Average Home Value in this Area
Purchase History
| Date | Buyer | Sale Price | Title Company |
|---|---|---|---|
| Arrington Sharion N | -- | None Available | |
| Arrington Richard L | $129,000 | -- | |
| Hunnicutt Builders Inc | -- | -- | |
| Hunnicutt Builders Inc | -- | -- | |
| Arrington Richard Lee | $15,000 | -- |
Source: Public Records
Mortgage History
| Date | Status | Borrower | Loan Amount |
|---|---|---|---|
| Open | Arrington Sharion N | $90,000 |
Source: Public Records
Tax History Compared to Growth
Tax History
| Year | Tax Paid | Tax Assessment Tax Assessment Total Assessment is a certain percentage of the fair market value that is determined by local assessors to be the total taxable value of land and additions on the property. | Land | Improvement |
|---|---|---|---|---|
| 2024 | $2,352 | $100,320 | $14,000 | $86,320 |
| 2023 | $2,169 | $91,720 | $14,000 | $77,720 |
| 2022 | $1,876 | $79,600 | $12,000 | $67,600 |
| 2021 | $1,733 | $73,320 | $12,000 | $61,320 |
| 2020 | $1,682 | $70,920 | $12,000 | $58,920 |
| 2019 | $1,629 | $68,720 | $12,000 | $56,720 |
| 2018 | $1,629 | $68,720 | $12,000 | $56,720 |
| 2017 | $1,630 | $68,720 | $12,000 | $56,720 |
| 2016 | $1,633 | $68,720 | $12,000 | $56,720 |
| 2015 | $1,626 | $68,320 | $12,000 | $56,320 |
| 2014 | -- | $68,320 | $12,000 | $56,320 |
| 2013 | -- | $68,320 | $12,000 | $56,320 |
Source: Public Records
Map
Nearby Homes
- 105 Wilkes Ct
- 109 Wilkes Ct
- 507 Scarlett Dr
- 509 Scarlett Dr
- 106 Wilkes Ct
- 103 Wilkes Ct
- 110 Wilkes Ct
- 104 Wilkes Ct
- 511 Scarlett Dr
- 503 Scarlett Dr
- 108 Wilkes Ct
- 102 Wilkes Ct
- 409 Scarlett Dr
- 407 Scarlett Dr
- 218 Twelve Oaks Dr
- 220 Twelve Oaks Dr
- 411 Scarlett Dr
- 506 Scarlett Dr
- 208 Rhett Ct
- 405 Scarlett Dr