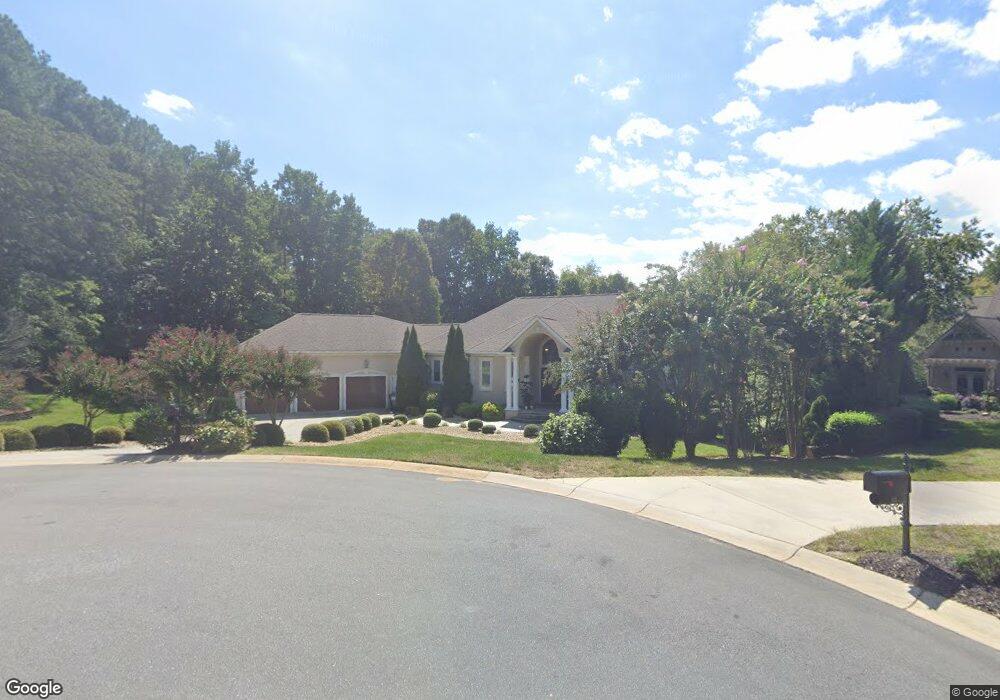
107 Windy Run Unit 53 Mooresville, NC 28117
Estimated Value: $801,000 - $1,250,000
3
Beds
4
Baths
6,455
Sq Ft
$171/Sq Ft
Est. Value
About This Home
This home is located at 107 Windy Run Unit 53, Mooresville, NC 28117 and is currently estimated at $1,102,109, approximately $170 per square foot. 107 Windy Run Unit 53 is a home located in Iredell County with nearby schools including Woodland Heights Elementary School and Lake Norman High School.
Ownership History
Date
Name
Owned For
Owner Type
Purchase Details
Closed on
Aug 13, 2018
Sold by
Sanders Lynn B
Bought by
Smore Laence D and Smore Laura A
Current Estimated Value
Home Financials for this Owner
Home Financials are based on the most recent Mortgage that was taken out on this home.
Original Mortgage
$464,000
Interest Rate
3.7%
Mortgage Type
New Conventional
Purchase Details
Closed on
Jun 27, 2017
Sold by
Sanders Lynn E
Bought by
Sanders Lynn E and Lynn E Sanders Trust
Purchase Details
Closed on
Aug 17, 1998
Sold by
Sipperly Andrew P and Sipperly Lesa F
Bought by
Stagliano Agostino and Stagliano Elisabetta
Home Financials for this Owner
Home Financials are based on the most recent Mortgage that was taken out on this home.
Original Mortgage
$55,000
Interest Rate
6.96%
Purchase Details
Closed on
Dec 1, 1996
Purchase Details
Closed on
Aug 1, 1996
Create a Home Valuation Report for This Property
The Home Valuation Report is an in-depth analysis detailing your home's value as well as a comparison with similar homes in the area
Home Values in the Area
Average Home Value in this Area
Purchase History
| Date | Buyer | Sale Price | Title Company |
|---|---|---|---|
| Smore Laence D | $580,000 | None Available | |
| Sanders Lynn E | -- | None Available | |
| Stagliano Agostino | $65,000 | -- | |
| -- | $59,900 | -- | |
| -- | -- | -- |
Source: Public Records
Mortgage History
| Date | Status | Borrower | Loan Amount |
|---|---|---|---|
| Previous Owner | Smore Laence D | $464,000 | |
| Previous Owner | Stagliano Agostino | $55,000 |
Source: Public Records
Tax History Compared to Growth
Tax History
| Year | Tax Paid | Tax Assessment Tax Assessment Total Assessment is a certain percentage of the fair market value that is determined by local assessors to be the total taxable value of land and additions on the property. | Land | Improvement |
|---|---|---|---|---|
| 2024 | $4,813 | $805,620 | $125,000 | $680,620 |
| 2023 | $4,813 | $805,620 | $125,000 | $680,620 |
| 2022 | $4,470 | $702,810 | $90,000 | $612,810 |
| 2021 | $4,466 | $702,810 | $90,000 | $612,810 |
| 2020 | $4,466 | $702,810 | $90,000 | $612,810 |
| 2019 | $4,396 | $702,810 | $90,000 | $612,810 |
| 2018 | $3,897 | $643,510 | $90,000 | $553,510 |
| 2017 | $3,897 | $643,510 | $90,000 | $553,510 |
| 2016 | $3,897 | $643,510 | $90,000 | $553,510 |
| 2015 | -- | $643,510 | $90,000 | $553,510 |
| 2014 | -- | $641,080 | $90,000 | $551,080 |
Source: Public Records
Map
Nearby Homes
- 124 Cedar Bluff Ln
- 126 Silver Eagle Ln
- 134 Lake Spring Loop
- 127 Pine Bluff Dr
- 117 Pine Bluff Dr
- 117 Indian Trail
- 115 Jonquil Ct
- 379 Indian Trail
- 472 Barber Loop
- 166 White Horse Dr
- 106 Ballston Dr
- 115 Union Chapel Dr
- 254 & 258 Southfork Rd
- 121 Marstons Mill Dr
- 133 Brick Kiln Way
- 5086 Windward Point Ln
- 108 Great Point Dr
- 142 Jeremy Point Place
- 143 Jeremy Point Place
- 168 Brownstone Dr
- 107 Windy Run
- 111 Windy Run
- 116 Hunters Pointe Ln
- 108 Windy Run Ln
- 108 Windy Run
- 395 Bay Harbour Rd
- 386 Bay Harbour Rd
- 385 Bay Harbour Rd
- 112 Windy Run
- 126 Hunters Pointe Ln
- 112 Windy Run Ln
- 378 Bay Harbour Rd
- 405 Bay Harbour Rd
- 134 Hunters Pointe Ln
- 377 Bay Harbour Rd
- 127 Hunters Pointe Ln
- 106 Island Cove Ln
- 140 Hunters Pointe Ln
- 132 Tranquil Cove Rd
- 136 Tranquil Cove Rd