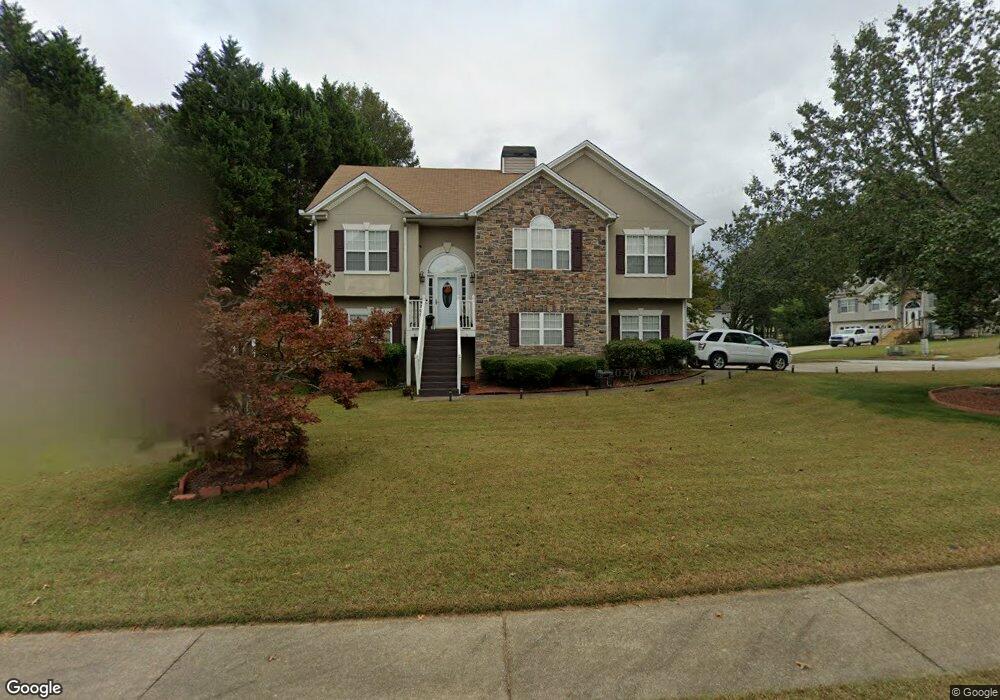
1070 Boseman Dr Lithia Springs, GA 30122
Lithia Springs NeighborhoodEstimated Value: $288,318 - $328,000
3
Beds
3
Baths
1,548
Sq Ft
$197/Sq Ft
Est. Value
About This Home
This home is located at 1070 Boseman Dr, Lithia Springs, GA 30122 and is currently estimated at $305,330, approximately $197 per square foot. 1070 Boseman Dr is a home located in Douglas County with nearby schools including Sweetwater Elementary School, Turner Middle School, and Lithia Springs Comprehensive High School.
Ownership History
Date
Name
Owned For
Owner Type
Purchase Details
Closed on
May 31, 2012
Sold by
Secretary Of Housing And U
Bought by
Molden Geneva
Current Estimated Value
Home Financials for this Owner
Home Financials are based on the most recent Mortgage that was taken out on this home.
Original Mortgage
$67,215
Outstanding Balance
$46,604
Interest Rate
3.84%
Mortgage Type
FHA
Estimated Equity
$258,726
Purchase Details
Closed on
Aug 3, 2010
Sold by
Flagstar Bk Fsb
Bought by
Hud-Housing Of Urban Dev
Purchase Details
Closed on
Aug 1, 2010
Sold by
Preston Augustus Eunice O and Preston Augustus
Bought by
Flagstar Bk Fsb
Purchase Details
Closed on
Jun 27, 1997
Sold by
Oxford Inc
Bought by
Hodson Susan
Create a Home Valuation Report for This Property
The Home Valuation Report is an in-depth analysis detailing your home's value as well as a comparison with similar homes in the area
Home Values in the Area
Average Home Value in this Area
Purchase History
| Date | Buyer | Sale Price | Title Company |
|---|---|---|---|
| Molden Geneva | $65,000 | -- | |
| Hud-Housing Of Urban Dev | -- | -- | |
| Flagstar Bk Fsb | $171,157 | -- | |
| Hodson Susan | $126,800 | -- |
Source: Public Records
Mortgage History
| Date | Status | Borrower | Loan Amount |
|---|---|---|---|
| Open | Molden Geneva | $67,215 | |
| Closed | Hodson Susan | -- |
Source: Public Records
Tax History Compared to Growth
Tax History
| Year | Tax Paid | Tax Assessment Tax Assessment Total Assessment is a certain percentage of the fair market value that is determined by local assessors to be the total taxable value of land and additions on the property. | Land | Improvement |
|---|---|---|---|---|
| 2024 | $2,527 | $106,960 | $24,000 | $82,960 |
| 2023 | $2,527 | $106,960 | $24,000 | $82,960 |
| 2022 | $2,347 | $93,920 | $20,000 | $73,920 |
| 2021 | $1,978 | $75,280 | $17,600 | $57,680 |
| 2020 | $1,798 | $64,960 | $11,320 | $53,640 |
| 2019 | $1,694 | $63,480 | $11,320 | $52,160 |
| 2018 | $1,659 | $61,360 | $11,320 | $50,040 |
| 2017 | $1,607 | $57,800 | $11,800 | $46,000 |
| 2016 | $1,285 | $41,520 | $8,760 | $32,760 |
| 2015 | $1,210 | $38,360 | $8,400 | $29,960 |
| 2014 | $1,036 | $32,520 | $7,680 | $24,840 |
| 2013 | -- | $32,960 | $7,800 | $25,160 |
Source: Public Records
Map
Nearby Homes
- 1657 Karsyn Ln
- 2790 Deerfield Dr
- 7306 Mount Vernon Rd
- 7368 Mount Vernon Rd
- 859 Aspen Dr
- 3138 Beechwood Dr
- 2019 Dutchess Rd
- 6889 Kingsboro Dr Unit 2
- 2948 Windsor Dr
- 3245 W Anderson Dr
- 3940 Fairhaven Rd
- 2765 Montie Ct
- 542 Hasty Dr
- 7621 Forest Glen Way Unit 2
- 7315 Lee Rd
- 0 W Lake Vulcan Dr Unit 10587241
- 3403 Linda Dr
- 3340 Skyview Dr
- 1657 Bradmere Ln
- 1070 Boseman Dr Unit 5
- 0 Boseman Dr Unit 7033952
- 0 Boseman Dr Unit 7036087
- 0 Boseman Dr Unit 3149980
- 0 Boseman Dr
- 1058 Boseman Dr Unit 5
- 1688 Silver Creek Dr Unit 5
- 1705 Silver Creek Dr
- 1693 Silver Creek Dr
- 1046 Boseman Dr Unit 5
- 1069 Boseman Dr Unit 5
- 1717 Silver Creek Dr Unit 5
- 1061 Boseman Dr Unit 5
- 1049 Silver Moon Trail Unit 5
- 1681 Silver Creek Dr
- 1063 Boseman Dr Unit 5
- 1729 Silver Creek Dr Unit 5
- 1041 Boseman Dr
- 1038 Boseman Dr Unit 1038
- 1038 Boseman Dr