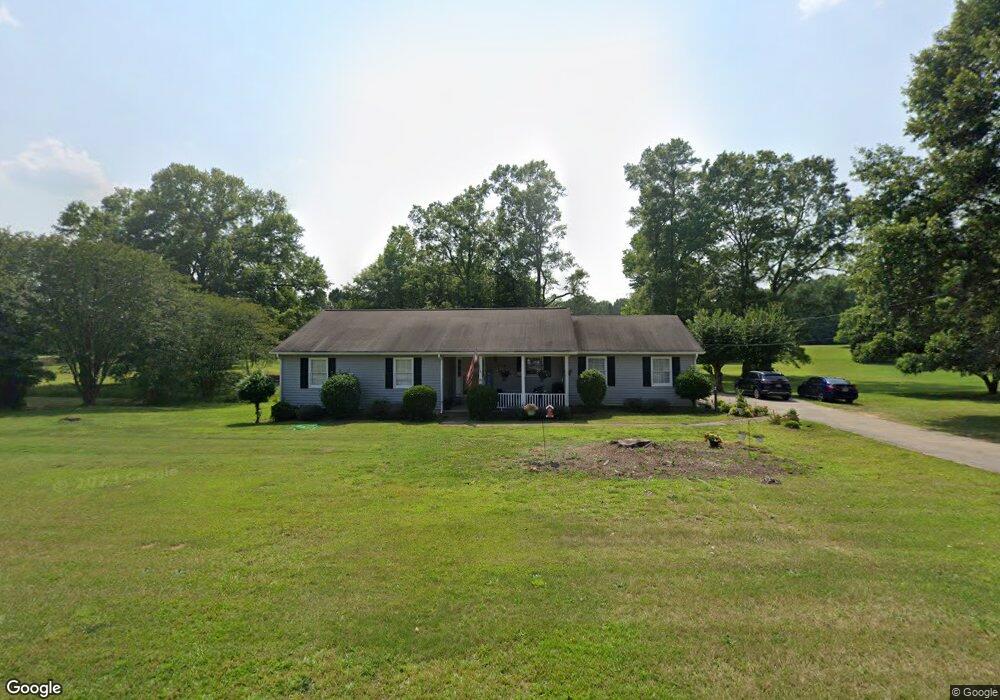
1070 Brooks Rd Madison, GA 30650
Estimated Value: $308,056 - $388,000
3
Beds
2
Baths
1,632
Sq Ft
$213/Sq Ft
Est. Value
About This Home
This home is located at 1070 Brooks Rd, Madison, GA 30650 and is currently estimated at $347,764, approximately $213 per square foot. 1070 Brooks Rd is a home located in Morgan County with nearby schools including Morgan County Primary School, Morgan County Elementary School, and Morgan County Middle School.
Ownership History
Date
Name
Owned For
Owner Type
Purchase Details
Closed on
Sep 2, 2005
Sold by
Carter Scott R
Bought by
Carter Scott R and Carter Amy H
Current Estimated Value
Purchase Details
Closed on
Feb 13, 2001
Sold by
Findley Lawrence E
Bought by
Carter Scott
Purchase Details
Closed on
May 21, 1997
Sold by
Suzann S Findley
Bought by
Findley Lawrence E
Purchase Details
Closed on
Dec 13, 1994
Sold by
Purcell Kenneth M
Bought by
Jones Clintona N
Create a Home Valuation Report for This Property
The Home Valuation Report is an in-depth analysis detailing your home's value as well as a comparison with similar homes in the area
Home Values in the Area
Average Home Value in this Area
Purchase History
| Date | Buyer | Sale Price | Title Company |
|---|---|---|---|
| Carter Scott R | -- | -- | |
| Carter Scott | $117,000 | -- | |
| Findley Lawrence E | $93,000 | -- | |
| Jones Clintona N | $75,500 | -- |
Source: Public Records
Tax History Compared to Growth
Tax History
| Year | Tax Paid | Tax Assessment Tax Assessment Total Assessment is a certain percentage of the fair market value that is determined by local assessors to be the total taxable value of land and additions on the property. | Land | Improvement |
|---|---|---|---|---|
| 2024 | $1,713 | $75,198 | $15,700 | $59,498 |
| 2023 | $1,624 | $69,092 | $15,700 | $53,392 |
| 2022 | $1,431 | $58,488 | $8,000 | $50,488 |
| 2021 | $1,358 | $55,288 | $4,800 | $50,488 |
| 2020 | $1,371 | $55,288 | $4,800 | $50,488 |
| 2019 | $1,359 | $53,960 | $4,800 | $49,160 |
| 2018 | $1,380 | $53,960 | $4,800 | $49,160 |
| 2017 | $1,337 | $51,600 | $4,800 | $46,800 |
| 2016 | $1,221 | $46,138 | $4,848 | $41,290 |
| 2015 | $1,207 | $45,040 | $4,800 | $40,240 |
| 2014 | $1,184 | $45,440 | $4,800 | $40,640 |
| 2013 | -- | $32,480 | $4,800 | $27,680 |
Source: Public Records
Map
Nearby Homes
- 1050 Eugene Ln
- 1071 Wildflower Way
- 1080 Brownwood Rd
- 1191 Wildflower Way
- 1190 Dixie Hwy
- 1113 Cornwall Dr
- 991 Old Post Rd
- 0 Double Bridges Rd Unit 7579574
- 0 Double Bridges Rd Unit 1023783
- 0 Double Bridges Rd Unit 67935
- 0 Double Bridges Rd Unit 10460793
- 617 Dixie Ave
- 724 Hill St
- 546 Fourth St
- 0 Apalachee Ridge Unit 23270055
- 0 Apalachee Ridge Unit 23542402
- 691 Skyline Dr
- 665 E Walton St
- 411 Old Post Rd
- 991 Crawford St
- 1071 Brooks Rd
- 1000 Norris Ln
- 1961 Atlanta Hwy
- 1101 Brooks Rd
- 1021 Brooks Rd
- 1021 Brooks Rd Unit 4
- 1030 Norris Ln
- 1021 Norris Ln
- 1991 Atlanta Hwy
- 1070 Norris Ln
- 1041 Norris Ln
- 1851 Atlanta Hwy
- 1151 Brooks Rd
- 1990 Atlanta Hwy
- 1163 Brooks Rd
- 1079 Norris Ln
- 1081 Norris Ln
- 1460 Confederate Rd
- 2041 Atlanta Hwy
- 1421 Brownwood Rd