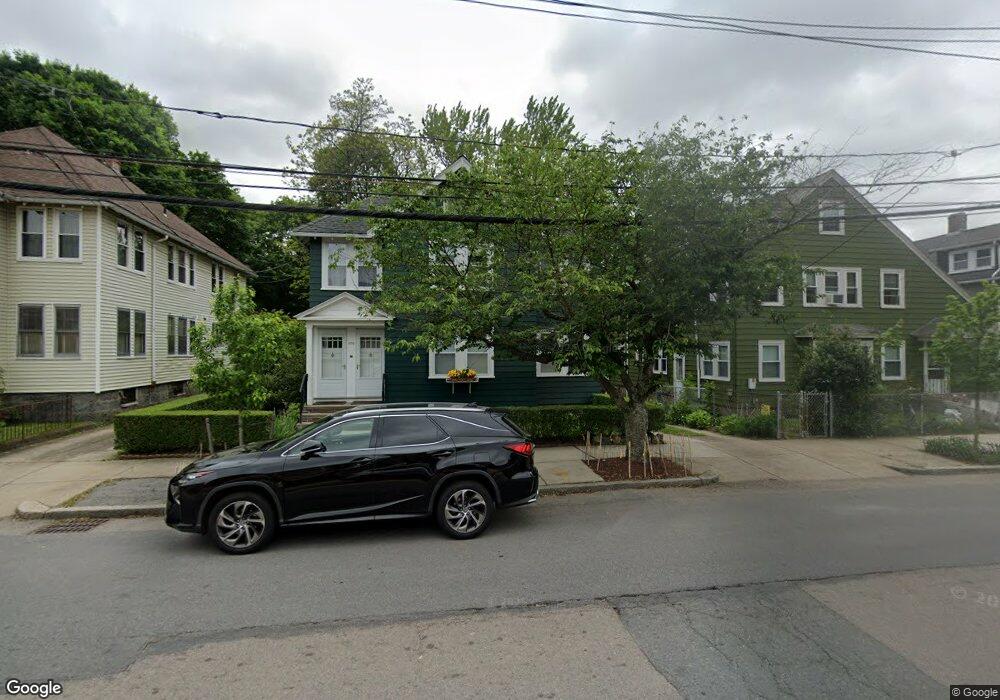
1070 Canterbury St Roslindale, MA 02131
Roslindale NeighborhoodEstimated Value: $878,000 - $1,201,000
6
Beds
2
Baths
2,358
Sq Ft
$423/Sq Ft
Est. Value
About This Home
This home is located at 1070 Canterbury St, Roslindale, MA 02131 and is currently estimated at $996,859, approximately $422 per square foot. 1070 Canterbury St is a home located in Suffolk County with nearby schools including Brooke Charter School Roslindale, Sacred Heart STEM School, and St. Clare High School.
Ownership History
Date
Name
Owned For
Owner Type
Purchase Details
Closed on
Jun 29, 1992
Sold by
Ricci Louis F
Bought by
Loving James C and Loving Janice B
Current Estimated Value
Home Financials for this Owner
Home Financials are based on the most recent Mortgage that was taken out on this home.
Original Mortgage
$166,200
Interest Rate
8.57%
Mortgage Type
Purchase Money Mortgage
Create a Home Valuation Report for This Property
The Home Valuation Report is an in-depth analysis detailing your home's value as well as a comparison with similar homes in the area
Home Values in the Area
Average Home Value in this Area
Purchase History
| Date | Buyer | Sale Price | Title Company |
|---|---|---|---|
| Loving James C | $175,000 | -- |
Source: Public Records
Mortgage History
| Date | Status | Borrower | Loan Amount |
|---|---|---|---|
| Open | Loving James C | $179,000 | |
| Closed | Loving James C | $166,200 |
Source: Public Records
Tax History Compared to Growth
Tax History
| Year | Tax Paid | Tax Assessment Tax Assessment Total Assessment is a certain percentage of the fair market value that is determined by local assessors to be the total taxable value of land and additions on the property. | Land | Improvement |
|---|---|---|---|---|
| 2025 | $8,942 | $772,200 | $292,400 | $479,800 |
| 2024 | $8,063 | $739,700 | $292,700 | $447,000 |
| 2023 | $7,637 | $711,100 | $281,400 | $429,700 |
| 2022 | $7,034 | $646,500 | $255,800 | $390,700 |
| 2021 | $6,839 | $641,000 | $250,800 | $390,200 |
| 2020 | $5,890 | $557,800 | $225,900 | $331,900 |
| 2019 | $5,547 | $526,300 | $182,500 | $343,800 |
| 2018 | $5,203 | $496,500 | $182,500 | $314,000 |
| 2017 | $5,153 | $486,600 | $182,500 | $304,100 |
| 2016 | $4,957 | $450,600 | $182,500 | $268,100 |
| 2015 | $4,776 | $394,400 | $167,000 | $227,400 |
| 2014 | $4,431 | $352,200 | $167,000 | $185,200 |
Source: Public Records
Map
Nearby Homes
- 2 Pinedale Rd Unit 3
- 650 Hyde Park Ave Unit 2
- 16 Hilburn Place
- 4 Rowe Ct
- 87 Clare Ave
- 250 Poplar St Unit 1
- 61 Whitford St
- 42 Doncaster St
- 42 Wilmot St
- 543 Hyde Park Ave Unit 1
- 886 Canterbury St
- 175 Clare Ave Unit B2
- 175 Clare Ave Unit B7
- 175 Clare Ave Unit B4
- 19-21 Augustus Ave
- 57 Hemman St
- 27 Rowe St
- 57 Mount Calvary Rd
- 42 Hemman St
- 3 Whitford St
- 1066 Canterbury St
- 1074 Canterbury St
- 1062 Canterbury St
- 1062 Canterbury St Unit 1
- 1078 Canterbury St
- 1078 Canterbury St Unit 2
- 14 Grew Ave
- 18 Grew Ave
- 1058 Canterbury St
- 1082 Canterbury St
- 1082 Canterbury St Unit 1
- 1082 Canterbury St
- 1082 Canterbury St Unit 2
- 22 Grew Ave
- 26 Grew Ave
- 15 Pinedale Rd
- 1084 Canterbury St Unit 1086
- 1086 Canterbury St Unit 1086
- 1084 Canterbury St Unit 2
- 1084 Canterbury St Unit 1