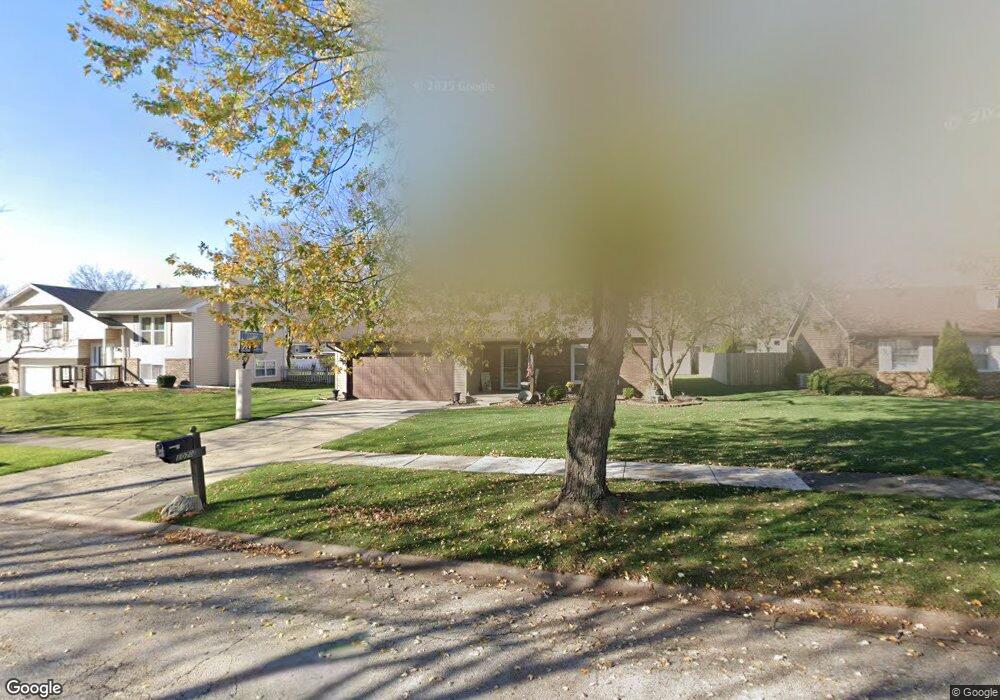
1070 Grenada Dr Aurora, IL 60506
Edgelawn Randall NeighborhoodEstimated Value: $348,000 - $388,000
4
Beds
4
Baths
1,876
Sq Ft
$196/Sq Ft
Est. Value
About This Home
This home is located at 1070 Grenada Dr, Aurora, IL 60506 and is currently estimated at $367,027, approximately $195 per square foot. 1070 Grenada Dr is a home located in Kane County with nearby schools including Hall Elementary School, Jefferson Middle School, and West Aurora High School.
Ownership History
Date
Name
Owned For
Owner Type
Purchase Details
Closed on
Aug 5, 2002
Sold by
Pruter Jeffrey J and Pruter Jeanne M
Bought by
Scroggins Eric L and Scroggins Shari L
Current Estimated Value
Home Financials for this Owner
Home Financials are based on the most recent Mortgage that was taken out on this home.
Original Mortgage
$144,000
Outstanding Balance
$60,890
Interest Rate
6.54%
Estimated Equity
$306,137
Purchase Details
Closed on
Apr 30, 1999
Sold by
Pruter Jeffrey J
Bought by
Pruter Jeffreyj and Pruter Jeanne M
Purchase Details
Closed on
Jan 17, 1997
Sold by
Murdock Rosalva and Messmer Rosalva
Bought by
Pruter Jeffrey J
Home Financials for this Owner
Home Financials are based on the most recent Mortgage that was taken out on this home.
Original Mortgage
$115,150
Interest Rate
7.66%
Create a Home Valuation Report for This Property
The Home Valuation Report is an in-depth analysis detailing your home's value as well as a comparison with similar homes in the area
Home Values in the Area
Average Home Value in this Area
Purchase History
| Date | Buyer | Sale Price | Title Company |
|---|---|---|---|
| Scroggins Eric L | $180,000 | -- | |
| Pruter Jeffreyj | -- | Chicago Title Insurance Co | |
| Pruter Jeffrey J | $135,500 | Law Title Insurance Co Inc |
Source: Public Records
Mortgage History
| Date | Status | Borrower | Loan Amount |
|---|---|---|---|
| Open | Scroggins Eric L | $144,000 | |
| Previous Owner | Pruter Jeffrey J | $115,150 |
Source: Public Records
Tax History
| Year | Tax Paid | Tax Assessment Tax Assessment Total Assessment is a certain percentage of the fair market value that is determined by local assessors to be the total taxable value of land and additions on the property. | Land | Improvement |
|---|---|---|---|---|
| 2024 | $7,929 | $108,139 | $15,912 | $92,227 |
| 2023 | $7,591 | $96,621 | $14,217 | $82,404 |
| 2022 | $7,273 | $88,158 | $12,972 | $75,186 |
| 2021 | $6,903 | $81,552 | $12,077 | $69,475 |
| 2020 | $6,530 | $75,750 | $11,218 | $64,532 |
| 2019 | $6,596 | $73,458 | $10,394 | $63,064 |
| 2018 | $6,049 | $66,591 | $9,614 | $56,977 |
| 2017 | $6,597 | $70,103 | $8,858 | $61,245 |
| 2016 | $6,167 | $64,049 | $7,593 | $56,456 |
| 2015 | -- | $54,242 | $6,529 | $47,713 |
| 2014 | -- | $48,890 | $6,279 | $42,611 |
| 2013 | -- | $48,195 | $6,190 | $42,005 |
Source: Public Records
Map
Nearby Homes
- 1930 Richard St Unit 1
- 1071 Almond Dr
- 980 Sapphire Ln
- 968 Sapphire Ln
- 960 Sapphire Ln
- 972 Sapphire Ln
- 988 Sapphire Ln
- 976 Sapphire Ln
- 984 Sapphire Ln
- 991 Sapphire Ln
- 959 Sapphire Ln
- 975 Sapphire Ln
- 963 Sapphire Ln
- 987 Sapphire Ln
- 1295 Foxcroft Dr
- 1086 Cascade Dr Unit 1
- 1322 Croton Ct Unit A
- 2140 Sandburg Dr
- 1475 Elder Dr
- 873 Shady Ln
- 1060 Grenada Dr
- 1080 Grenada Dr
- 1071 Laurel Dr
- 1061 Laurel Dr
- 1081 Laurel Dr
- 1050 Grenada Dr
- 1090 Grenada Dr Unit 9
- 1071 Grenada Dr Unit 9
- 1091 Laurel Dr
- 1051 Laurel Dr Unit 3
- 1081 Grenada Dr
- 1061 Grenada Dr
- 1100 Grenada Dr
- 2011 Coral Ave
- 1091 Grenada Dr
- 1051 Grenada Dr
- 1101 Laurel Dr
- 2021 Coral Ave
- 1101 Grenada Dr
- 1971 Coral Ave
Your Personal Tour Guide
Ask me questions while you tour the home.