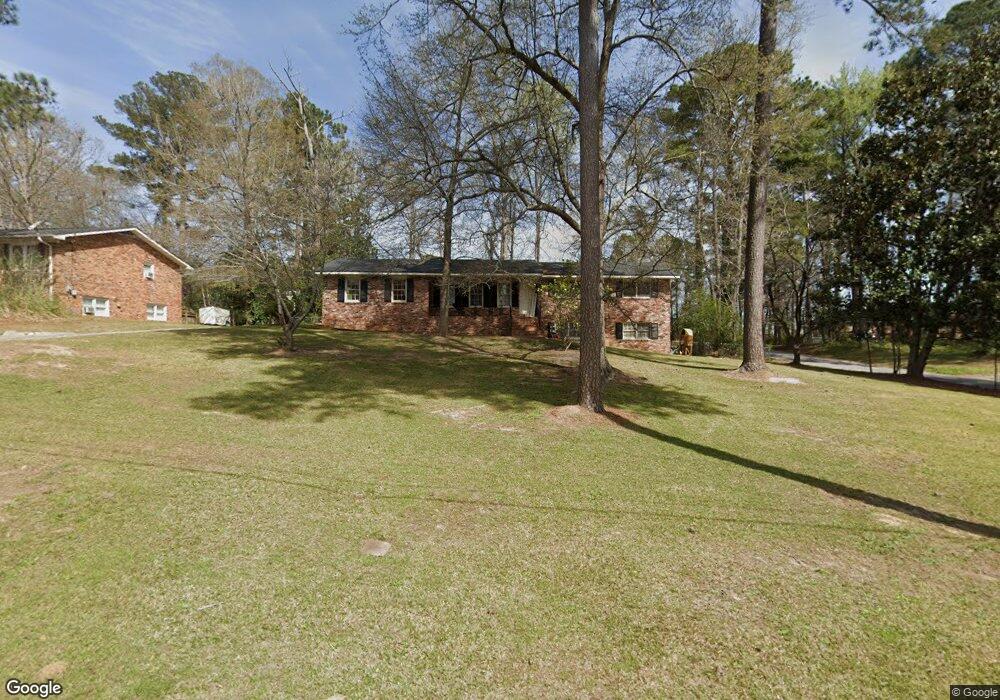
1070 Hill Place Macon, GA 31210
Estimated Value: $195,000 - $241,000
4
Beds
3
Baths
1,555
Sq Ft
$138/Sq Ft
Est. Value
About This Home
This home is located at 1070 Hill Place, Macon, GA 31210 and is currently estimated at $215,079, approximately $138 per square foot. 1070 Hill Place is a home located in Bibb County with nearby schools including Lane Elementary School, Howard Middle School, and Howard High School.
Ownership History
Date
Name
Owned For
Owner Type
Purchase Details
Closed on
Feb 19, 2014
Sold by
Bank Of America Na
Bought by
Smaha Jerry
Current Estimated Value
Purchase Details
Closed on
Jan 2, 2013
Sold by
Matlock Michael E and Matlock Geri L
Bought by
Bank Of America Na
Purchase Details
Closed on
Dec 23, 2009
Sold by
Welsh Kevin B
Bought by
Matlock Michael E and Matlock Geri L
Home Financials for this Owner
Home Financials are based on the most recent Mortgage that was taken out on this home.
Original Mortgage
$117,826
Interest Rate
4.92%
Mortgage Type
FHA
Purchase Details
Closed on
Feb 18, 2009
Sold by
Fannie Mae
Bought by
Welsh Kevin B
Purchase Details
Closed on
Oct 7, 2008
Sold by
Sun Trust Mortgage Inc
Bought by
Federal Nat'L Mortgage Assoc
Create a Home Valuation Report for This Property
The Home Valuation Report is an in-depth analysis detailing your home's value as well as a comparison with similar homes in the area
Home Values in the Area
Average Home Value in this Area
Purchase History
| Date | Buyer | Sale Price | Title Company |
|---|---|---|---|
| Smaha Jerry | $45,000 | None Available | |
| Bank Of America Na | $128,900 | None Available | |
| Matlock Michael E | $120,000 | None Available | |
| Welsh Kevin B | -- | None Available | |
| Federal Nat'L Mortgage Assoc | -- | -- | |
| Federal National Mortgage Association | $76,913 | None Available | |
| Suntrust Mortgage Inc | $76,913 | None Available |
Source: Public Records
Mortgage History
| Date | Status | Borrower | Loan Amount |
|---|---|---|---|
| Previous Owner | Matlock Michael E | $117,826 |
Source: Public Records
Tax History Compared to Growth
Tax History
| Year | Tax Paid | Tax Assessment Tax Assessment Total Assessment is a certain percentage of the fair market value that is determined by local assessors to be the total taxable value of land and additions on the property. | Land | Improvement |
|---|---|---|---|---|
| 2025 | $1,709 | $69,536 | $13,780 | $55,756 |
| 2024 | $1,657 | $65,248 | $13,780 | $51,468 |
| 2023 | $1,494 | $58,814 | $13,780 | $45,034 |
| 2022 | $2,158 | $62,327 | $10,152 | $52,175 |
| 2021 | $2,059 | $54,181 | $8,528 | $45,653 |
| 2020 | $2,050 | $52,808 | $8,528 | $44,280 |
| 2019 | $1,852 | $47,316 | $8,528 | $38,788 |
| 2018 | $2,762 | $43,072 | $7,716 | $35,356 |
| 2017 | $1,527 | $40,759 | $8,149 | $32,610 |
| 2016 | $1,351 | $39,042 | $8,149 | $30,893 |
| 2015 | $881 | $39,042 | $8,149 | $30,893 |
| 2014 | $2,347 | $41,664 | $9,055 | $32,610 |
Source: Public Records
Map
Nearby Homes
- 1161 Ousley Place
- 3678 Northside Dr
- 3640 Northside Dr
- 3622 Northside Dr
- 3602 Northside Dr
- 4070 Carrie Ct
- 870 Glen Hill Ct
- 4015 Elnora Dr
- 3500 Northside Dr
- 1197 Matthews Place
- 1246 Newport Rd
- 859 Forest Lake Dr S
- 825 Forest Lake Dr S
- 1270 Lake Valley Rd
- 1344 Lake Valley Rd
- 938 Lundy Terrace
- 3658 Northside Dr
- 161 Ten Knolls Dr
- 753 Lokchapee Dr
- 731 Lokchapee Dr
- 1060 Hill Place
- 1093 Underwood Dr
- 1100 Hill Place
- 1083 Underwood Dr
- 1071 Hill Place
- 1052 Hill Place
- 1052 Hill Place Unit 403
- 1105 Uundewood Dr
- 1061 Hill Place
- 1105 Underwood Dr
- 1071 Underwood Dr
- 1101 Hill Place
- 1053 Hill Place
- 1108 Hill Place
- 1044 Hill Place
- 1061 Underwood Dr
- 1109 Hill Place
- 1109 Hill Place Unit 303
- 1094 Underwood Dr
- 1084 Underwood Dr