1070 Reese Rd Rutledge, GA 30663
Estimated Value: $624,000 - $706,000
5
Beds
3
Baths
2,875
Sq Ft
$231/Sq Ft
Est. Value
About This Home
This home is located at 1070 Reese Rd, Rutledge, GA 30663 and is currently estimated at $665,118, approximately $231 per square foot. 1070 Reese Rd is a home located in Morgan County with nearby schools including Morgan County Primary School, Morgan County Elementary School, and Morgan County Middle School.
Ownership History
Date
Name
Owned For
Owner Type
Purchase Details
Closed on
Mar 22, 2021
Sold by
Tiller Jo P
Bought by
Purcell Jospeh Michael
Current Estimated Value
Purchase Details
Closed on
May 22, 2014
Sold by
Tiller Jo P
Bought by
Tiller Jo P and Purcell Joseph Michael
Purchase Details
Closed on
Jun 24, 2008
Sold by
Purcell Joseph
Bought by
Tiller Jo
Purchase Details
Closed on
Nov 15, 2004
Sold by
Tiller Jo
Bought by
Tiller Jo P
Purchase Details
Closed on
Jun 9, 2004
Sold by
Moss Dennis G
Bought by
Tiller Jo
Purchase Details
Closed on
Sep 2, 2003
Sold by
Cumming Jason Adam
Bought by
Moss Dennis G
Purchase Details
Closed on
Sep 16, 1998
Sold by
Morton Butch
Bought by
Cumming Jason Adam
Purchase Details
Closed on
Jun 17, 1998
Sold by
Machelle Morton
Bought by
Morton Butch
Create a Home Valuation Report for This Property
The Home Valuation Report is an in-depth analysis detailing your home's value as well as a comparison with similar homes in the area
Home Values in the Area
Average Home Value in this Area
Purchase History
| Date | Buyer | Sale Price | Title Company |
|---|---|---|---|
| Purcell Jospeh Michael | -- | -- | |
| Tiller Jo P | -- | -- | |
| Tiller Jo | -- | -- | |
| Tiller Jo P | -- | -- | |
| Tiller Jo | $260,000 | -- | |
| Moss Dennis G | $50,000 | -- | |
| Cumming Jason Adam | $34,900 | -- | |
| Morton Butch | $23,700 | -- |
Source: Public Records
Tax History Compared to Growth
Tax History
| Year | Tax Paid | Tax Assessment Tax Assessment Total Assessment is a certain percentage of the fair market value that is determined by local assessors to be the total taxable value of land and additions on the property. | Land | Improvement |
|---|---|---|---|---|
| 2025 | $5,150 | $229,802 | $50,600 | $179,202 |
| 2024 | $4,485 | $196,847 | $44,978 | $151,869 |
| 2023 | $4,131 | $175,781 | $39,356 | $136,425 |
| 2022 | $3,778 | $154,442 | $24,340 | $130,102 |
| 2021 | $3,302 | $151,840 | $21,738 | $130,102 |
| 2020 | $3,333 | $151,840 | $21,738 | $130,102 |
| 2019 | $3,387 | $151,840 | $21,738 | $130,102 |
| 2018 | $3,437 | $151,840 | $21,738 | $130,102 |
| 2017 | $3,922 | $151,375 | $21,738 | $129,637 |
| 2016 | $2,918 | $127,760 | $19,320 | $108,440 |
| 2015 | $2,951 | $127,760 | $19,320 | $108,440 |
| 2014 | $2,779 | $127,760 | $19,320 | $108,440 |
| 2013 | -- | $86,560 | $17,560 | $69,000 |
Source: Public Records
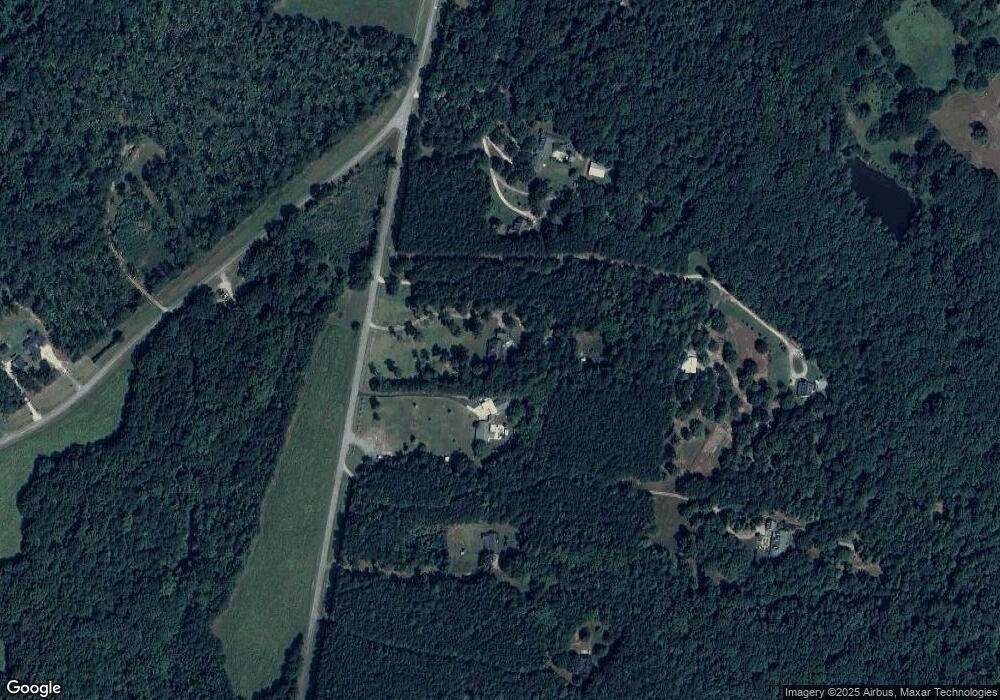
Map
Nearby Homes
- 1051 Longwood Dr
- 1051 Long Wood Dr
- 0 Dickson Rd Unit 10568585
- 2470 Fears Rd
- 0 Fears Rd Unit 10647993
- 0 Fears Rd Unit 7684722
- 0 Fears Rd Unit CL344239
- 0 Fears Rd Unit 69810
- 0 Fears Rd Unit 10647985
- 0 Fears Rd Unit 10569285
- 3641 Davis Academy Rd
- 00 Fears Rd
- 00 Fears Rd
- 3780 Brownwood Rd
- 1151 Fears Rd
- 1060 Sewell Church Rd
- 0 Reese Rd Unit 10622381
- 0 Reese Rd Unit 25651133
- 294 Tuscany Dr
- 1031 Graham Dr
- 1100 Reese Rd
- 1000 Reese Rd
- LOT 5 Reese Rd
- LOT 7 Reese Rd
- 1170 Reese Rd
- 1090 Dickson Rd
- 1170 Dickson Rd
- LOTS 1-3 Reese Rd
- 1040 Reese Rd
- 1180 Reese Rd
- 1140 Reese Rd
- 1061 Dickson Rd
- 4630 Brownwood Rd
- 4730 Brownwood Rd
- 1200 Reese Rd
- 1241 Dickson Rd
- 1221 Reese Rd
- 1261 Dickson Rd
- 1250 Reese Rd
- 1240 Reese Rd