Estimated Value: $447,889 - $485,000
3
Beds
2
Baths
1,272
Sq Ft
$368/Sq Ft
Est. Value
About This Home
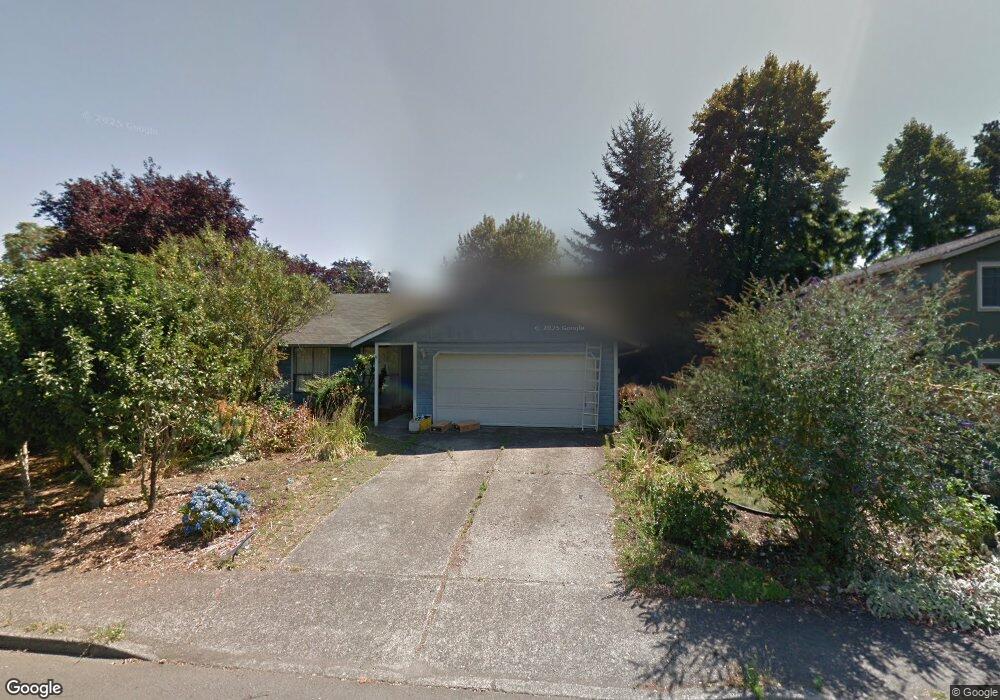
This home is located at 1070 S Elm St, Canby, OR 97013 and is currently estimated at $468,222, approximately $368 per square foot. 1070 S Elm St is a home located in Clackamas County with nearby schools including Josefa L. Sambrano Elementary School, Philander Lee Elementary School, and Baker Prairie Middle School.
Ownership History
Date
Name
Owned For
Owner Type
Purchase Details
Closed on
Apr 16, 2019
Sold by
Fisher Schultz Katherine and Fisher Katherine
Bought by
Fisher Schultz Katherine
Current Estimated Value
Home Financials for this Owner
Home Financials are based on the most recent Mortgage that was taken out on this home.
Original Mortgage
$53,000
Outstanding Balance
$46,596
Interest Rate
4.4%
Mortgage Type
Credit Line Revolving
Estimated Equity
$421,626
Purchase Details
Closed on
Jun 25, 2003
Sold by
Fogdall Kaj and Fogdall Brenda
Bought by
Fisher Katherine
Home Financials for this Owner
Home Financials are based on the most recent Mortgage that was taken out on this home.
Original Mortgage
$165,404
Outstanding Balance
$69,685
Interest Rate
5.37%
Mortgage Type
FHA
Estimated Equity
$398,537
Purchase Details
Closed on
Feb 18, 2000
Sold by
Brooks Caroline
Bought by
Fogdall Kay and Anderson Brenda
Purchase Details
Closed on
Jun 24, 1996
Sold by
Evans Andrew Frederick
Bought by
Hulit Lola Ferne
Create a Home Valuation Report for This Property
The Home Valuation Report is an in-depth analysis detailing your home's value as well as a comparison with similar homes in the area
Home Values in the Area
Average Home Value in this Area
Purchase History
| Date | Buyer | Sale Price | Title Company |
|---|---|---|---|
| Fisher Schultz Katherine | -- | Wfg Lender Services | |
| Fisher Katherine | $168,000 | Chicago Title Insurance Comp | |
| Fogdall Kay | $138,500 | Chicago Title Insurance Co | |
| Hulit Lola Ferne | $126,000 | Stewart Title |
Source: Public Records
Mortgage History
| Date | Status | Borrower | Loan Amount |
|---|---|---|---|
| Open | Fisher Schultz Katherine | $53,000 | |
| Open | Fisher Katherine | $165,404 |
Source: Public Records
Tax History Compared to Growth
Tax History
| Year | Tax Paid | Tax Assessment Tax Assessment Total Assessment is a certain percentage of the fair market value that is determined by local assessors to be the total taxable value of land and additions on the property. | Land | Improvement |
|---|---|---|---|---|
| 2025 | $4,226 | $238,559 | -- | -- |
| 2024 | $4,108 | $231,611 | -- | -- |
| 2023 | $4,108 | $224,866 | $0 | $0 |
| 2022 | $3,778 | $218,317 | $0 | $0 |
| 2021 | $3,639 | $211,959 | $0 | $0 |
| 2020 | $3,573 | $205,786 | $0 | $0 |
| 2019 | $3,403 | $199,793 | $0 | $0 |
| 2018 | $3,327 | $193,974 | $0 | $0 |
| 2017 | $3,243 | $188,324 | $0 | $0 |
| 2016 | $3,134 | $182,839 | $0 | $0 |
| 2015 | $3,027 | $177,514 | $0 | $0 |
| 2014 | $2,940 | $172,344 | $0 | $0 |
Source: Public Records
Map
Nearby Homes
- 1491 S Fir St Unit 18
- 1487 S Fir St Unit Lot17
- 1485 S Fir St Unit Lot 16
- 1400 S Elm St Unit 91
- 476 SW 15th Ave
- 1339 S Baywood Ct
- 442 SW 15th Ave Unit 15
- 448 SW 15th Ave Unit 14
- 452 SW 15th Ave Unit 13
- 481 S Holly St
- 431 SW 3rd Ave
- 1655 S Elm St Unit 2
- 1655 S Elm St
- 1655 S Elm St Unit 302
- 201 SE 16th Ave
- 1198 SW 1st Ave
- 574 S Ivy St
- 248 SE Township Rd
- 331 SE 9th Ave
- 224 SW 18th Ave