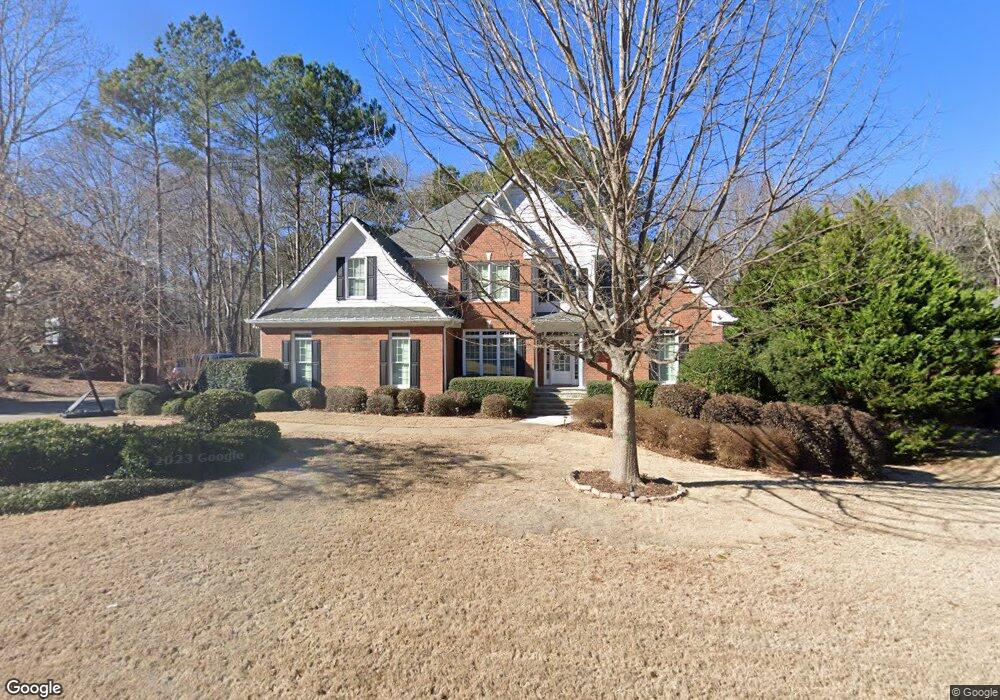
1070 Spring Valley Way Bishop, GA 30621
Estimated Value: $766,942 - $857,000
5
Beds
5
Baths
4,120
Sq Ft
$200/Sq Ft
Est. Value
About This Home
This home is located at 1070 Spring Valley Way, Bishop, GA 30621 and is currently estimated at $824,986, approximately $200 per square foot. 1070 Spring Valley Way is a home located in Oconee County with nearby schools including High Shoals Elementary School, Oconee County Middle School, and Oconee County High School.
Ownership History
Date
Name
Owned For
Owner Type
Purchase Details
Closed on
Dec 28, 2017
Sold by
Dohrmann Thomas E
Bought by
Martin Amanda S
Current Estimated Value
Home Financials for this Owner
Home Financials are based on the most recent Mortgage that was taken out on this home.
Original Mortgage
$346,400
Outstanding Balance
$186,816
Interest Rate
3.9%
Mortgage Type
New Conventional
Estimated Equity
$638,170
Purchase Details
Closed on
May 31, 2005
Sold by
Lewis
Bought by
Dohrmann Thomas E and Dohrmann Elizabeth R
Home Financials for this Owner
Home Financials are based on the most recent Mortgage that was taken out on this home.
Original Mortgage
$346,700
Interest Rate
5.38%
Mortgage Type
New Conventional
Purchase Details
Closed on
Jun 10, 2004
Sold by
Boulder Springs Development Llc
Bought by
Lewis & Heard Development Llc
Create a Home Valuation Report for This Property
The Home Valuation Report is an in-depth analysis detailing your home's value as well as a comparison with similar homes in the area
Purchase History
| Date | Buyer | Sale Price | Title Company |
|---|---|---|---|
| Martin Amanda S | $433,000 | -- | |
| Dohrmann Thomas E | $433,400 | -- | |
| Lewis & Heard Development Llc | $49,900 | -- |
Source: Public Records
Mortgage History
| Date | Status | Borrower | Loan Amount |
|---|---|---|---|
| Open | Martin Amanda S | $346,400 | |
| Previous Owner | Dohrmann Thomas E | $346,700 | |
| Previous Owner | Dohrmann Thomas E | $65,000 |
Source: Public Records
Tax History
| Year | Tax Paid | Tax Assessment Tax Assessment Total Assessment is a certain percentage of the fair market value that is determined by local assessors to be the total taxable value of land and additions on the property. | Land | Improvement |
|---|---|---|---|---|
| 2025 | $5,008 | $287,964 | $36,000 | $251,964 |
| 2024 | $5,008 | $247,620 | $33,000 | $214,620 |
| 2023 | $4,628 | $237,289 | $32,000 | $205,289 |
| 2022 | $4,348 | $202,881 | $28,000 | $174,881 |
| 2021 | $4,366 | $188,939 | $28,000 | $160,939 |
| 2020 | $4,189 | $181,027 | $28,000 | $153,027 |
| 2019 | $3,990 | $172,450 | $28,000 | $144,450 |
| 2018 | $3,861 | $163,418 | $24,000 | $139,418 |
| 2017 | $3,640 | $154,075 | $24,000 | $130,075 |
| 2016 | $3,594 | $152,124 | $24,000 | $128,124 |
| 2015 | $3,613 | $152,622 | $24,000 | $128,622 |
| 2014 | $3,748 | $154,805 | $24,000 | $130,805 |
Source: Public Records
Map
Nearby Homes
- 1031 Spring Lake Dr
- 3511 New High Shoals Rd
- 2037 Boulder Ridge Ln
- 1858 Boulder Ridge Ln
- 1171 Spring Lake Dr
- 1080 Oak Ridge Ct
- 2012 Shoal Creek Way
- 1698 Shoal Creek Way
- 1150 Glen Ln
- 2351 Elder Rd
- 1040 Pimlico Ln
- 1015 Turtle Pond Dr
- 6534 Whitlow Creek Dr
- 4662 Whitlow Ridge Dr
- 2361 Elder Rd
- 2893 Whitlow Ridge Dr
- 1295 Stonewood Field Rd
- 1025 Stonewood Field Rd
- 1321 Cemetery Rd
- 1070(38D Spring Valley Way
- 1070(45D Spring Valley Way
- 1080 Spring Valley Way
- 1060(46D Spring Valley Way
- 1100(43) Spring Valley Way
- 1100 Spring Valley Way
- 1010 Spring Lake Dr
- 1010(34D Spring Lake Dr
- 1050 Spring Valley Way
- 1050(47D Spring Valley Way
- 1061 Spring Valley Way
- 1061(4F) Spring Valley Way
- 1061 Ridgeview Ln
- 1061(51) Ridgeview Ln
- 1101(35D Spring Valley Way
- 1051 Ridgeview Ln
- 1101 Spring Valley Way
- 1051(50D Ridgeview Ln
- 1110 (42 Spring Valley Way
- 1110 Spring Valley Way
Your Personal Tour Guide
Ask me questions while you tour the home.