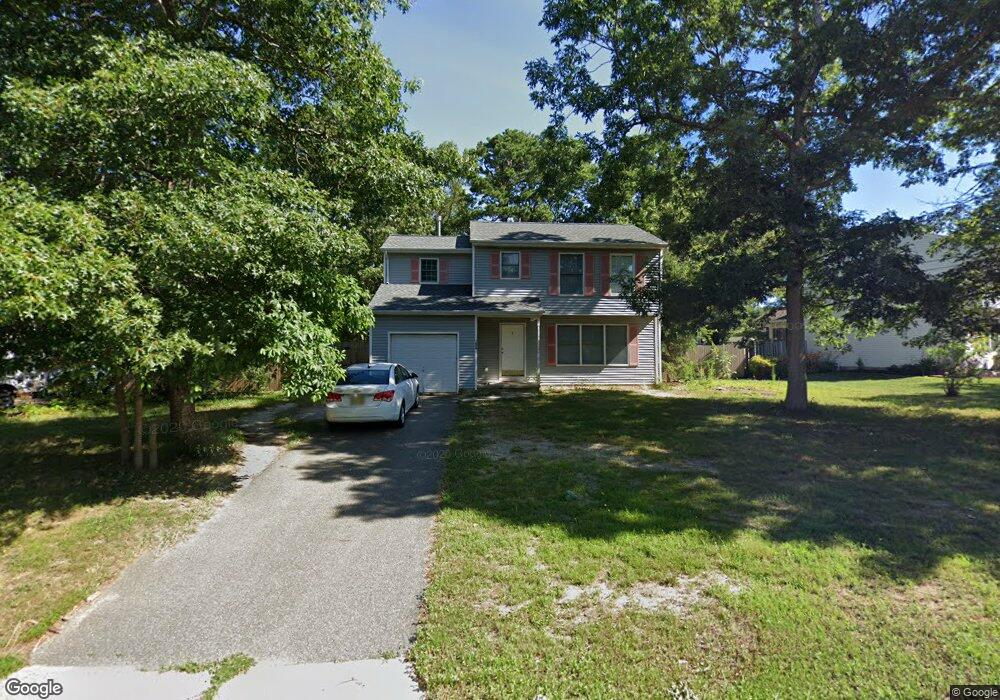
1070 Windlass Dr Manahawkin, NJ 08050
Stafford NeighborhoodEstimated Value: $408,000 - $489,000
4
Beds
2
Baths
1,440
Sq Ft
$315/Sq Ft
Est. Value
About This Home
This home is located at 1070 Windlass Dr, Manahawkin, NJ 08050 and is currently estimated at $454,204, approximately $315 per square foot. 1070 Windlass Dr is a home located in Ocean County with nearby schools including Ocean Acres Elementary School, Oxycocus Elementary School, and McKinley Avenue Elementary School.
Ownership History
Date
Name
Owned For
Owner Type
Purchase Details
Closed on
Jun 21, 2021
Sold by
Bartley Marie C
Bought by
Bartley Mariah
Current Estimated Value
Home Financials for this Owner
Home Financials are based on the most recent Mortgage that was taken out on this home.
Original Mortgage
$245,471
Outstanding Balance
$222,243
Interest Rate
2.9%
Mortgage Type
FHA
Estimated Equity
$231,961
Purchase Details
Closed on
Feb 13, 1998
Sold by
Tupper Lake Inc
Bought by
Bartley Marie C
Home Financials for this Owner
Home Financials are based on the most recent Mortgage that was taken out on this home.
Original Mortgage
$55,000
Interest Rate
7.11%
Create a Home Valuation Report for This Property
The Home Valuation Report is an in-depth analysis detailing your home's value as well as a comparison with similar homes in the area
Home Values in the Area
Average Home Value in this Area
Purchase History
| Date | Buyer | Sale Price | Title Company |
|---|---|---|---|
| Bartley Mariah | $250,000 | University Title | |
| Bartley Mariah | $250,000 | University Title | |
| Bartley Marie C | $112,000 | -- |
Source: Public Records
Mortgage History
| Date | Status | Borrower | Loan Amount |
|---|---|---|---|
| Open | Bartley Mariah | $245,471 | |
| Closed | Bartley Mariah | $245,471 | |
| Previous Owner | Bartley Marie C | $55,000 |
Source: Public Records
Tax History Compared to Growth
Tax History
| Year | Tax Paid | Tax Assessment Tax Assessment Total Assessment is a certain percentage of the fair market value that is determined by local assessors to be the total taxable value of land and additions on the property. | Land | Improvement |
|---|---|---|---|---|
| 2025 | $5,103 | $205,500 | $63,300 | $142,200 |
| 2024 | $5,053 | $205,500 | $63,300 | $142,200 |
| 2023 | $4,837 | $205,500 | $63,300 | $142,200 |
| 2022 | $4,837 | $205,500 | $63,300 | $142,200 |
| 2021 | $4,522 | $205,500 | $63,300 | $142,200 |
| 2020 | $4,778 | $205,500 | $63,300 | $142,200 |
| 2019 | $4,710 | $205,500 | $63,300 | $142,200 |
| 2018 | $4,681 | $205,500 | $63,300 | $142,200 |
| 2017 | $4,739 | $201,400 | $63,300 | $138,100 |
| 2016 | $4,441 | $201,400 | $63,300 | $138,100 |
| 2015 | $4,275 | $201,400 | $63,300 | $138,100 |
| 2014 | $4,202 | $195,700 | $62,500 | $133,200 |
Source: Public Records
Map
Nearby Homes
- 1079 Helm Ave
- 159 Bluejacket Ave
- 252 Nautilus Dr
- 140 Riptide Ave
- 189 Lighthouse Dr
- 135 Nautilus Dr
- 248 Matey Ave
- 1073 Cutlass Ave
- 120 Riptide Ave
- 296 Nautilus Dr
- 937 Sandy Cir
- 1174 Steamer Ave
- 55 Holloway Ave
- 163 Bradshaw Dr
- 117 Autumn Oak Ln
- 1015 Barnacle Dr
- 1195 Windlass Dr
- 1186 Galley Ave
- 1018 Vessel Ln
- 1215 Canal Ave
- 1074 Windlass Dr
- 1079 Sailor Dr
- 1075 Sailor Dr
- 1062 Windlass Dr
- 1083 Sailor Dr
- 1078 Windlass Dr
- 1063 Windlass Dr
- 1059 Windlass Dr
- 1067 Windlass Dr
- 1071 Windlass Dr
- 1058 Windlass Dr
- 1067 Sailor Dr
- 1055 Windlass Dr
- 1075 Windlass Dr
- 1063 Sailor Dr
- 1042 White Cap Ave
- 1054 Windlass Dr
- 1079 Windlass Dr
- 1074 Sailor Dr
- 1038 White Cap Ave