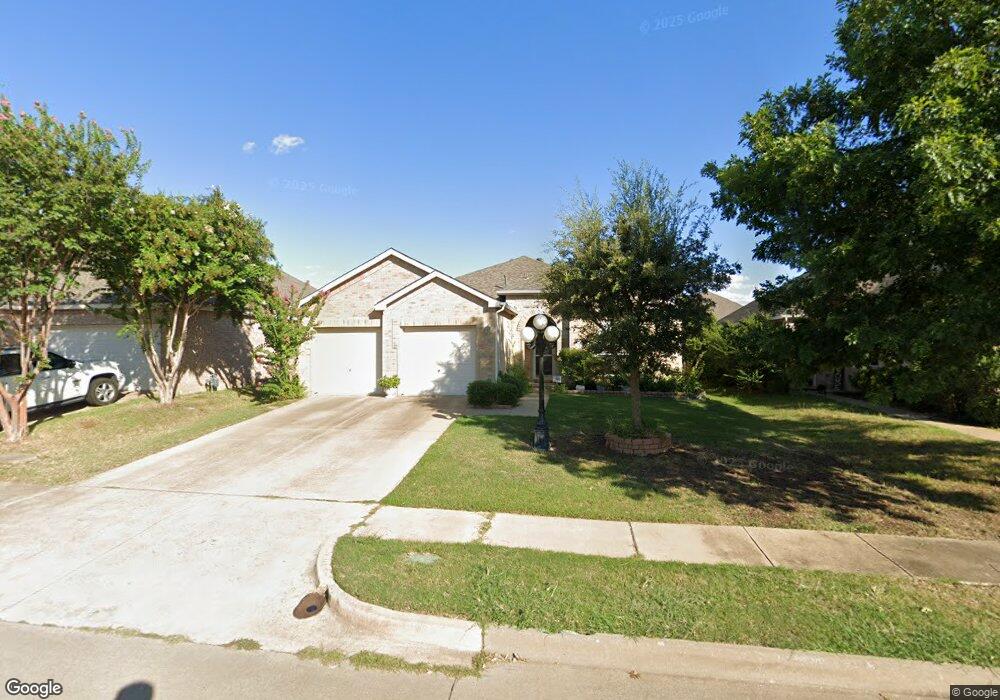
10702 Lansdowne Ln Rowlett, TX 75089
Waterview NeighborhoodEstimated Value: $350,000 - $409,000
3
Beds
2
Baths
1,948
Sq Ft
$190/Sq Ft
Est. Value
About This Home
This home is located at 10702 Lansdowne Ln, Rowlett, TX 75089 and is currently estimated at $370,882, approximately $190 per square foot. 10702 Lansdowne Ln is a home located in Dallas County with nearby schools including Providence Academy.
Ownership History
Date
Name
Owned For
Owner Type
Purchase Details
Closed on
Mar 14, 2022
Sold by
Yung Nguyen Eva and Yung William Adam
Bought by
Salabogi Jamie and Salabogi Eneri
Current Estimated Value
Home Financials for this Owner
Home Financials are based on the most recent Mortgage that was taken out on this home.
Original Mortgage
$313,500
Outstanding Balance
$292,910
Interest Rate
3.92%
Mortgage Type
New Conventional
Estimated Equity
$77,972
Purchase Details
Closed on
Feb 17, 2006
Sold by
Weisinger Carey and Weisinger Chad
Bought by
Dang Adam William and Nguyen Eva Yung
Home Financials for this Owner
Home Financials are based on the most recent Mortgage that was taken out on this home.
Original Mortgage
$21,900
Interest Rate
6.05%
Mortgage Type
Stand Alone Second
Purchase Details
Closed on
Nov 28, 2001
Sold by
Centex Homes
Bought by
Henderson Lerald H and Henderson Carey D
Home Financials for this Owner
Home Financials are based on the most recent Mortgage that was taken out on this home.
Original Mortgage
$150,118
Interest Rate
6.57%
Mortgage Type
FHA
Create a Home Valuation Report for This Property
The Home Valuation Report is an in-depth analysis detailing your home's value as well as a comparison with similar homes in the area
Home Values in the Area
Average Home Value in this Area
Purchase History
| Date | Buyer | Sale Price | Title Company |
|---|---|---|---|
| Salabogi Jamie | -- | Dorsett Johnson & Swift Llp | |
| Dang Adam William | -- | Atc | |
| Henderson Lerald H | -- | -- |
Source: Public Records
Mortgage History
| Date | Status | Borrower | Loan Amount |
|---|---|---|---|
| Open | Salabogi Jamie | $313,500 | |
| Previous Owner | Dang Adam William | $21,900 | |
| Previous Owner | Dang Adam William | $116,800 | |
| Previous Owner | Henderson Lerald H | $150,118 |
Source: Public Records
Tax History Compared to Growth
Tax History
| Year | Tax Paid | Tax Assessment Tax Assessment Total Assessment is a certain percentage of the fair market value that is determined by local assessors to be the total taxable value of land and additions on the property. | Land | Improvement |
|---|---|---|---|---|
| 2025 | $6,483 | $355,270 | $100,000 | $255,270 |
| 2024 | $6,483 | $336,970 | $90,000 | $246,970 |
| 2023 | $6,483 | $336,970 | $90,000 | $246,970 |
| 2022 | $8,165 | $336,970 | $90,000 | $246,970 |
| 2021 | $6,770 | $258,620 | $70,000 | $188,620 |
| 2020 | $5,664 | $214,470 | $55,000 | $159,470 |
| 2019 | $6,163 | $214,470 | $55,000 | $159,470 |
| 2018 | $5,929 | $204,880 | $50,000 | $154,880 |
| 2017 | $5,945 | $204,880 | $50,000 | $154,880 |
| 2016 | $5,231 | $180,270 | $50,000 | $130,270 |
| 2015 | $3,075 | $157,110 | $50,000 | $107,110 |
| 2014 | $3,075 | $128,430 | $50,000 | $78,430 |
Source: Public Records
Map
Nearby Homes
- 10702 Augusta Ln
- 10706 Augusta Ln
- 10618 Newcastleton Ln
- 10606 Greenbriar Ln
- 10410 Augusta Ln
- 10805 Winged Foot Dr
- 10210 Links Fairway Dr
- 3305 Elm Grove Rd
- 10013 Waterview Pkwy
- 10714 Waterview Pkwy
- 10217 Broadmoor Ln
- 10205 Broadmoor Ln
- 10601 Huffines Dr
- 10302 Fairway Vista Dr
- 10014 Fairway Vista Dr
- 9506 Glenshee Dr
- 9601 Waterview Pkwy
- 9610 Broadmoor Ln
- 3485 Stonewall Rd
- 8410 Player Dr
- 10618 Lansdowne Ln
- 10706 Lansdowne Ln
- 10614 Lansdowne Ln
- 10617 Augusta Ln
- 10621 Augusta Ln
- 10613 Augusta Ln
- 10609 Augusta Ln
- 10610 Lansdowne Ln
- 10701 Lansdowne Ln
- 10710 Lansdowne Ln
- 10617 Lansdowne Ln
- 10705 Lansdowne Ln
- 10613 Lansdowne Ln
- 10701 Augusta Ln
- 10709 Lansdowne Ln
- 10605 Augusta Ln
- 10606 Lansdowne Ln
- 10714 Lansdowne Ln
- 10713 Lansdowne Ln
- 10705 Augusta Ln