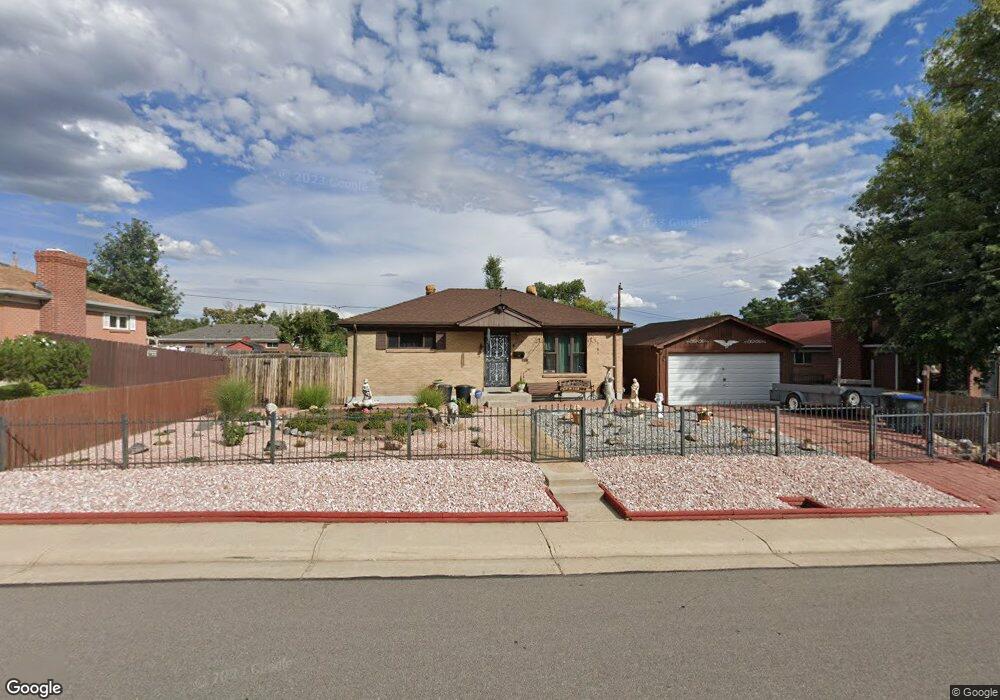
10702 Larson Dr Northglenn, CO 80233
Estimated Value: $400,004 - $482,000
3
Beds
2
Baths
1,700
Sq Ft
$254/Sq Ft
Est. Value
About This Home
This home is located at 10702 Larson Dr, Northglenn, CO 80233 and is currently estimated at $431,751, approximately $253 per square foot. 10702 Larson Dr is a home located in Adams County with nearby schools including Woodglen Elementary School, Leroy Drive Elementary School, and Northglenn Middle School.
Ownership History
Date
Name
Owned For
Owner Type
Purchase Details
Closed on
Jun 22, 2023
Sold by
Leintz Bernard C
Bought by
Bernard C Leintz Living Trust
Current Estimated Value
Purchase Details
Closed on
Mar 31, 2021
Sold by
Lesntz Bernad Christian and Estate Of Ranby Pau Leiniz
Bought by
Leintz Bernard Christian
Purchase Details
Closed on
Jul 21, 2012
Sold by
Milnes Diane and Cronin Becky
Bought by
Leintz Bernard C
Purchase Details
Closed on
Mar 20, 1999
Sold by
Milnes Diane
Bought by
Milnes Diane and Copeland James H
Purchase Details
Closed on
Jun 6, 1995
Sold by
Copeland James H
Bought by
Copeland Martha R
Purchase Details
Closed on
Jul 8, 1994
Sold by
Metzel Barbara Lopata
Bought by
Copeland James H and Copeland Martha R
Purchase Details
Closed on
Jun 6, 1994
Sold by
Morton Industrial Company
Bought by
Copeland James H and Copeland Martha R
Create a Home Valuation Report for This Property
The Home Valuation Report is an in-depth analysis detailing your home's value as well as a comparison with similar homes in the area
Home Values in the Area
Average Home Value in this Area
Purchase History
| Date | Buyer | Sale Price | Title Company |
|---|---|---|---|
| Bernard C Leintz Living Trust | -- | None Listed On Document | |
| Leintz Bernard Christian | -- | None Available | |
| Leintz Bernard C | $165,000 | Guardian Title | |
| Milnes Diane | -- | -- | |
| Copeland Martha R | -- | -- | |
| Copeland James H | -- | -- | |
| Copeland James H | -- | -- | |
| Copeland James H | -- | -- |
Source: Public Records
Tax History
| Year | Tax Paid | Tax Assessment Tax Assessment Total Assessment is a certain percentage of the fair market value that is determined by local assessors to be the total taxable value of land and additions on the property. | Land | Improvement |
|---|---|---|---|---|
| 2025 | $2,229 | $28,430 | $6,260 | $22,170 |
| 2024 | $2,229 | $26,130 | $5,750 | $20,380 |
| 2023 | $2,209 | $29,150 | $5,610 | $23,540 |
| 2022 | $2,989 | $23,670 | $5,770 | $17,900 |
| 2021 | $3,085 | $23,670 | $5,770 | $17,900 |
| 2020 | $2,803 | $21,940 | $5,930 | $16,010 |
| 2019 | $2,805 | $21,940 | $5,930 | $16,010 |
| 2018 | $2,241 | $17,080 | $5,400 | $11,680 |
| 2017 | $2,062 | $17,080 | $5,400 | $11,680 |
| 2016 | $1,653 | $13,370 | $3,020 | $10,350 |
| 2015 | $1,650 | $13,370 | $3,020 | $10,350 |
| 2014 | -- | $11,300 | $2,390 | $8,910 |
Source: Public Records
Map
Nearby Homes
- 1102 Leroy Dr
- 10891 Mildred Dr
- 10844 Pearl Ct
- 10486 Corona St
- 10575 Washington Way
- 10572 Washington Way
- 10519 Lafayette St
- 802 Muriel Dr
- 10448 Pearl Way
- 10440 Pennsylvania St
- 242 Pike St
- 340 Leonard Ln
- 201 E 108th Ave
- 10475 Grant Dr
- 1025 Elmer Dr
- 598 Emery Rd
- 1502 E 110th Place
- 265 Linda Sue Ln
- 80 E 106th Ave
- 160 E 105th Ave
- 10682 Larson Dr
- 10701 Larry Dr
- 10681 Larry Dr
- 10711 Larry Dr
- 10722 Larson Dr
- 10671 Larry Dr
- 10713 Larson Dr
- 10683 Larson Dr
- 10721 Larry Dr
- 10662 Larson Dr
- 10673 Larson Dr
- 10732 Larson Dr
- 10723 Larson Dr
- 10661 Larry Dr
- 10731 Larry Dr
- 10680 Larry Dr
- 10731R Larry Dr
- 10663 Larson Dr
- 10710 Larry Dr
- 10670 Larry Dr
Your Personal Tour Guide
Ask me questions while you tour the home.