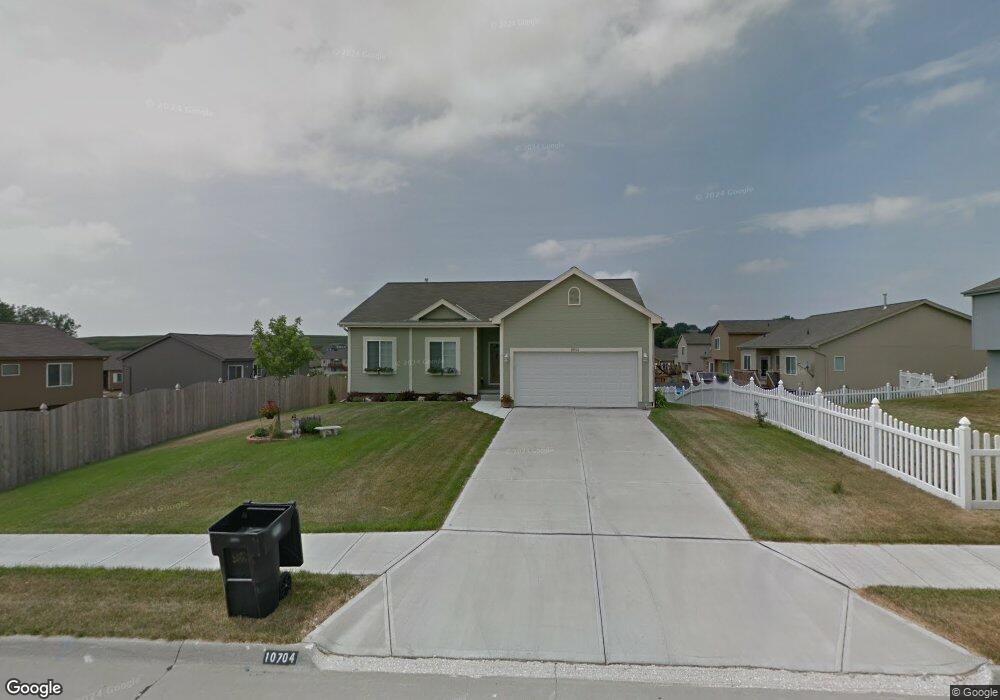
10704 Lewis And Clark Rd Bellevue, NE 68123
Estimated Value: $295,046 - $313,000
3
Beds
2
Baths
1,404
Sq Ft
$217/Sq Ft
Est. Value
About This Home
This home is located at 10704 Lewis And Clark Rd, Bellevue, NE 68123 and is currently estimated at $305,262, approximately $217 per square foot. 10704 Lewis And Clark Rd is a home located in Sarpy County with nearby schools including Fort Crook Elementary School, Logan Fontenelle Middle School, and Bellevue West High School.
Ownership History
Date
Name
Owned For
Owner Type
Purchase Details
Closed on
Sep 1, 2020
Sold by
Delisi Sara and Webster Sara Anne
Bought by
Webster Management Llc
Current Estimated Value
Purchase Details
Closed on
Jun 4, 2019
Sold by
Delisi August and Delisi Marlene
Bought by
Webster Sara Anne
Home Financials for this Owner
Home Financials are based on the most recent Mortgage that was taken out on this home.
Original Mortgage
$167,430
Outstanding Balance
$147,212
Interest Rate
4.1%
Mortgage Type
New Conventional
Estimated Equity
$158,050
Purchase Details
Closed on
Sep 30, 2009
Sold by
Celebrity Townhomes Inc
Bought by
Delisi August and Delisi Marlene
Home Financials for this Owner
Home Financials are based on the most recent Mortgage that was taken out on this home.
Original Mortgage
$50,000
Interest Rate
5.12%
Create a Home Valuation Report for This Property
The Home Valuation Report is an in-depth analysis detailing your home's value as well as a comparison with similar homes in the area
Home Values in the Area
Average Home Value in this Area
Purchase History
| Date | Buyer | Sale Price | Title Company |
|---|---|---|---|
| Webster Management Llc | -- | None Available | |
| Webster Sara Anne | $205,000 | Dri Title & Escrow | |
| Delisi August | $160,000 | Fat |
Source: Public Records
Mortgage History
| Date | Status | Borrower | Loan Amount |
|---|---|---|---|
| Open | Webster Sara Anne | $167,430 | |
| Previous Owner | Delisi August | $50,000 |
Source: Public Records
Tax History Compared to Growth
Tax History
| Year | Tax Paid | Tax Assessment Tax Assessment Total Assessment is a certain percentage of the fair market value that is determined by local assessors to be the total taxable value of land and additions on the property. | Land | Improvement |
|---|---|---|---|---|
| 2025 | $4,786 | $262,719 | $45,000 | $217,719 |
| 2024 | $5,458 | $245,286 | $40,000 | $205,286 |
| 2023 | $5,458 | $237,739 | $40,000 | $197,739 |
| 2022 | $5,325 | $219,024 | $35,000 | $184,024 |
| 2021 | $4,868 | $197,532 | $32,000 | $165,532 |
| 2020 | $4,843 | $195,615 | $32,000 | $163,615 |
| 2019 | $4,510 | $182,959 | $32,000 | $150,959 |
| 2018 | $4,112 | $169,385 | $28,000 | $141,385 |
| 2017 | $4,294 | $164,757 | $28,000 | $136,757 |
| 2016 | $4,045 | $157,927 | $28,000 | $129,927 |
| 2015 | $3,832 | $152,252 | $28,000 | $124,252 |
| 2014 | $3,858 | $149,528 | $28,000 | $121,528 |
| 2012 | -- | $150,625 | $28,000 | $122,625 |
Source: Public Records
Map
Nearby Homes
- 10808 Lewis And Clark Rd
- 11004 S 18th St
- 2601 Calvin St
- 9608 S 26th Ave
- 9605 S 27th St
- 9607 S 24th St
- 9513 S 26th Ave
- 10700 Old 36th St Unit 10706
- 2616 Tulip Ln
- 2303 Lola Ave
- 10014 S 14th St
- 10106 S 13th St
- 1406 Sunshine Blvd
- 2813 Bryan Ave
- 1213 Willow Ave
- 2618 Geri Dr
- 8954 S 21st St
- 2116 Gindy Dr
- 9903 S 10th St
- 2804 Greensboro Ave
- 2607 Yorktown St
- 10711 S 27th Ave
- 2609 Yorktown St
- 10709 S 27th Ave
- 10707 S 27th Ave
- 2611 Yorktown St
- 10705 Lewis And Clark Rd
- 10703 Lewis And Clark Rd
- 10707 Lewis And Clark Rd
- 10701 Lewis And Clark Rd
- 2613 Yorktown St
- 10709 Lewis And Clark Rd
- 10610 Lewis And Clark Rd
- 10710 S 27th Ave
- 10708 S 27th Ave
- 10712 S 27th Ave
- 10716 S 27th Ave
- 10714 S 27th Ave
- 10611 S 27th St
- 10706 S 27th Ave