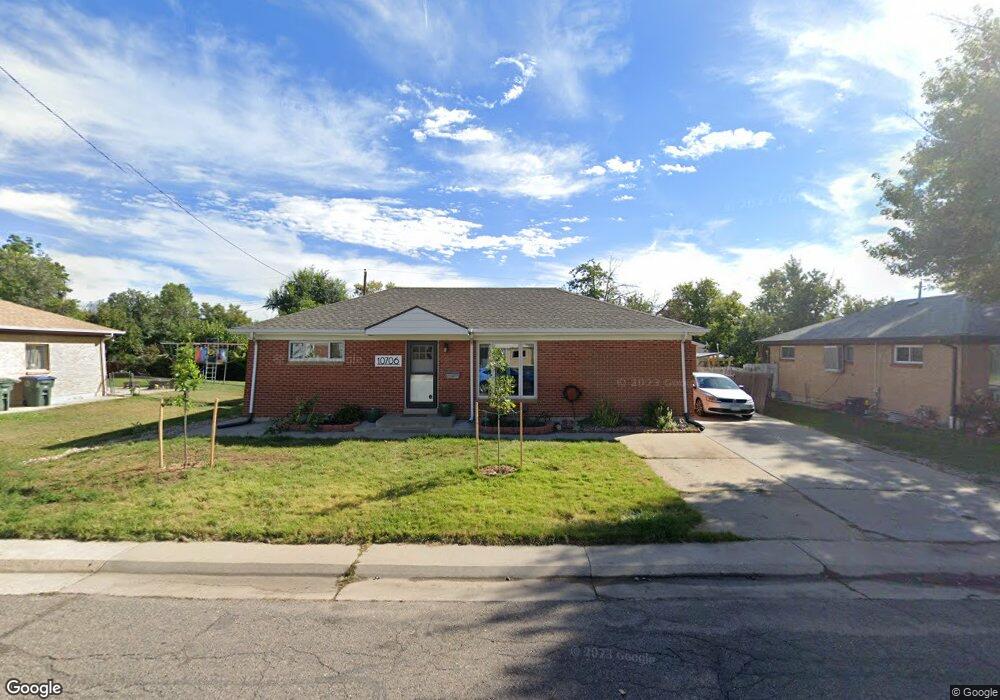
10706 Logan Ct Northglenn, CO 80233
Estimated Value: $470,000 - $499,000
4
Beds
2
Baths
1,975
Sq Ft
$245/Sq Ft
Est. Value
About This Home
This home is located at 10706 Logan Ct, Northglenn, CO 80233 and is currently estimated at $483,344, approximately $244 per square foot. 10706 Logan Ct is a home located in Adams County with nearby schools including Stukey Elementary School, Northglenn Middle School, and Thornton High School.
Ownership History
Date
Name
Owned For
Owner Type
Purchase Details
Closed on
Oct 13, 2022
Sold by
Mills Thomas and Mills Nichole
Bought by
Mills Thomas
Current Estimated Value
Purchase Details
Closed on
Nov 15, 2019
Sold by
Huynh Tai
Bought by
Mills Thomas P and Esqueda Nichole
Home Financials for this Owner
Home Financials are based on the most recent Mortgage that was taken out on this home.
Original Mortgage
$332,710
Interest Rate
3.5%
Mortgage Type
New Conventional
Purchase Details
Closed on
Apr 2, 2013
Sold by
The Calvert Trust
Bought by
Huynh Tai
Home Financials for this Owner
Home Financials are based on the most recent Mortgage that was taken out on this home.
Original Mortgage
$162,011
Interest Rate
3.25%
Mortgage Type
FHA
Purchase Details
Closed on
Nov 13, 1999
Sold by
Mae Calvert Viola
Bought by
The Calvert Trust
Create a Home Valuation Report for This Property
The Home Valuation Report is an in-depth analysis detailing your home's value as well as a comparison with similar homes in the area
Home Values in the Area
Average Home Value in this Area
Purchase History
| Date | Buyer | Sale Price | Title Company |
|---|---|---|---|
| Mills Thomas | -- | -- | |
| Mills Thomas P | $343,000 | Heritage Title Company | |
| Huynh Tai | $165,000 | Empire Title Co Springs Llc | |
| The Calvert Trust | -- | -- |
Source: Public Records
Mortgage History
| Date | Status | Borrower | Loan Amount |
|---|---|---|---|
| Previous Owner | Mills Thomas P | $332,710 | |
| Previous Owner | Huynh Tai | $162,011 |
Source: Public Records
Tax History Compared to Growth
Tax History
| Year | Tax Paid | Tax Assessment Tax Assessment Total Assessment is a certain percentage of the fair market value that is determined by local assessors to be the total taxable value of land and additions on the property. | Land | Improvement |
|---|---|---|---|---|
| 2024 | $3,636 | $29,380 | $5,750 | $23,630 |
| 2023 | $3,602 | $34,160 | $5,610 | $28,550 |
| 2022 | $3,250 | $24,930 | $5,770 | $19,160 |
| 2021 | $3,250 | $24,930 | $5,770 | $19,160 |
| 2020 | $2,947 | $23,070 | $5,930 | $17,140 |
| 2019 | $2,949 | $23,070 | $5,930 | $17,140 |
| 2018 | $2,427 | $18,500 | $5,400 | $13,100 |
| 2017 | $2,233 | $18,500 | $5,400 | $13,100 |
| 2016 | $1,956 | $15,820 | $3,020 | $12,800 |
| 2015 | $1,952 | $15,820 | $3,020 | $12,800 |
| 2014 | -- | $12,710 | $2,390 | $10,320 |
Source: Public Records
Map
Nearby Homes
- 189 E 107th Place
- 10752 Blue Jay Ln
- 10475 Grant Dr
- 10453 Washington Way
- 10452 Washington Way
- 10472 Lincoln Ct
- 10440 Pennsylvania St
- 10448 Pearl Way
- 925 E 108th Ave
- 10951 Acoma St
- 1102 Leroy Dr
- 10966 Alvin Dr
- 10674 Downing St
- 380 E 111th Place
- 500 E 111th Place
- 10761 Rosalie Dr
- 10768 Roseanna Dr
- 1324 Lucille Ct
- 10429 Lafayette St
- 12820 Inca St
- 10696 Logan Ct
- 10716 Logan Ct
- 10717 Northglenn Dr
- 10707 Northglenn Dr
- 10686 Logan Ct
- 10727 Northglenn Dr
- 10726 Logan Ct
- 10695 Logan Ct
- 10685 Logan Ct
- 10697 Northglenn Dr
- 10705 Logan Ct
- 10676 Logan Ct
- 10737 Northglenn Dr
- 10715 Logan Ct
- 10687 Northglenn Dr
- 10665 Logan Ct
- 10684 Grant Dr
- 10708 Northglenn Dr
- 10674 Grant Dr
- 10694 Grant Dr