10707 Laurens Dr NE Bolivar, OH 44612
Estimated Value: $429,000 - $481,000
4
Beds
3
Baths
3,518
Sq Ft
$128/Sq Ft
Est. Value
About This Home
This home is located at 10707 Laurens Dr NE, Bolivar, OH 44612 and is currently estimated at $451,561, approximately $128 per square foot. 10707 Laurens Dr NE is a home located in Tuscarawas County with nearby schools including Tuscarawas Valley Primary School, Tuscarawas Valley Intermediate School, and Tuscarawas Valley Middle School.
Ownership History
Date
Name
Owned For
Owner Type
Purchase Details
Closed on
Jun 21, 2021
Sold by
Kenosky Paul E
Bought by
Kenosky Paul E and Kenosky Amanda R
Current Estimated Value
Purchase Details
Closed on
Oct 26, 2006
Sold by
Kenosky Paul E and Kenosky Holly L
Bought by
Kenosky Paul E
Home Financials for this Owner
Home Financials are based on the most recent Mortgage that was taken out on this home.
Original Mortgage
$27,800
Interest Rate
6%
Mortgage Type
Stand Alone Second
Purchase Details
Closed on
Oct 15, 2001
Sold by
Tegtmeier Terry E
Bought by
Kenosky Paul E and Kenosky Holly L
Home Financials for this Owner
Home Financials are based on the most recent Mortgage that was taken out on this home.
Original Mortgage
$10,000
Interest Rate
6.99%
Mortgage Type
New Conventional
Purchase Details
Closed on
May 31, 1988
Sold by
Wilkin J R
Bought by
Tegtmeier Terry E and Tegtmeier Brenda G
Create a Home Valuation Report for This Property
The Home Valuation Report is an in-depth analysis detailing your home's value as well as a comparison with similar homes in the area
Home Values in the Area
Average Home Value in this Area
Purchase History
| Date | Buyer | Sale Price | Title Company |
|---|---|---|---|
| Kenosky Paul E | -- | None Available | |
| Kenosky Paul E | -- | Title Works | |
| Kenosky Paul E | $44,000 | -- | |
| Tegtmeier Terry E | $5,000 | -- |
Source: Public Records
Mortgage History
| Date | Status | Borrower | Loan Amount |
|---|---|---|---|
| Closed | Kenosky Paul E | $27,800 | |
| Open | Kenosky Paul E | $239,400 | |
| Closed | Kenosky Paul E | $10,000 |
Source: Public Records
Tax History Compared to Growth
Tax History
| Year | Tax Paid | Tax Assessment Tax Assessment Total Assessment is a certain percentage of the fair market value that is determined by local assessors to be the total taxable value of land and additions on the property. | Land | Improvement |
|---|---|---|---|---|
| 2024 | $5,933 | $123,950 | $14,340 | $109,610 |
| 2023 | $5,933 | $354,140 | $40,960 | $313,180 |
| 2022 | $5,874 | $123,949 | $14,336 | $109,613 |
| 2021 | $5,462 | $109,824 | $15,572 | $94,252 |
| 2020 | $5,463 | $109,824 | $15,572 | $94,252 |
| 2019 | $5,166 | $109,824 | $15,572 | $94,252 |
| 2018 | $4,638 | $92,680 | $13,140 | $79,540 |
| 2017 | $4,658 | $92,680 | $13,140 | $79,540 |
| 2016 | $4,630 | $92,680 | $13,140 | $79,540 |
| 2014 | $4,593 | $86,430 | $11,950 | $74,480 |
| 2013 | $3,750 | $86,430 | $11,950 | $74,480 |
Source: Public Records
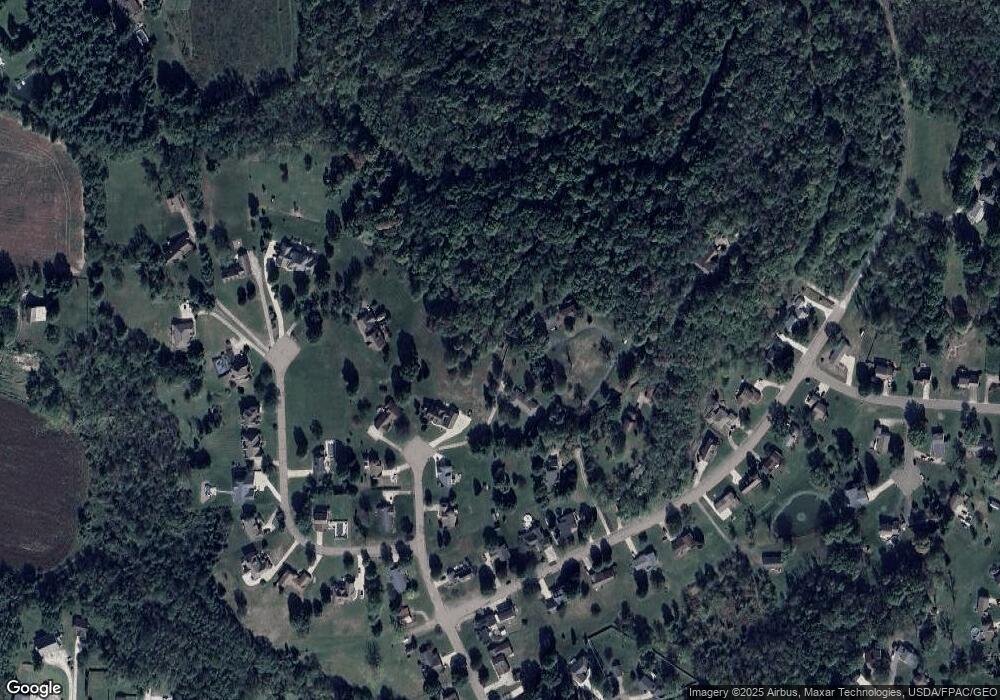
Map
Nearby Homes
- 0 Kerns Dr NE
- 10419 Laurens Dr NE
- 11162 Northwood Ave NE
- 11121 Northwood Ave NE
- 827 Melissa St NE
- 797 Glenda St NE
- 11167 Northwood Ave NE
- 1557 N Orchard Rd NE
- 1517 NE North Orchard Rd
- 10988 Madlyn St NE
- 10952 Madlyn St NE
- 720 Holly St NE
- 10884 Madlyn St NE
- 1678 N Orchard Rd NE
- 11275 Indian Hills Dr NE
- 1750 N Orchard Rd NE
- 379 Olde Orchard Dr NE
- 0 State Route 212 Unit 4441887
- VL Hess Mill Rd NE
- 9738 Kennett Square NE
- 10710 Laurens Dr NE
- 10691 Laurens Dr NE
- 10696 Laurens Dr NE
- 10703 Laurens Dr NE
- 10677 Laurens Dr NE
- 10869 N Laurens Square NE
- 10672 Laurens Dr NE
- 10772 Buehler Rd NE
- 10809 N Laurens Square NE
- 0 N Laurens Dr NE
- 10736 Buehler Rd NE
- 10756 Buehler Rd NE
- 10720 Buehler Rd NE
- 10768 Buehler Rd NE
- 10777 N Laurens Square NE
- 10782 Buehler Rd NE
- 10654 Laurens Dr NE
- 10790 Buehler Rd NE
- 10794 N Laurens Square NE
- 10738 Laurens Square NE