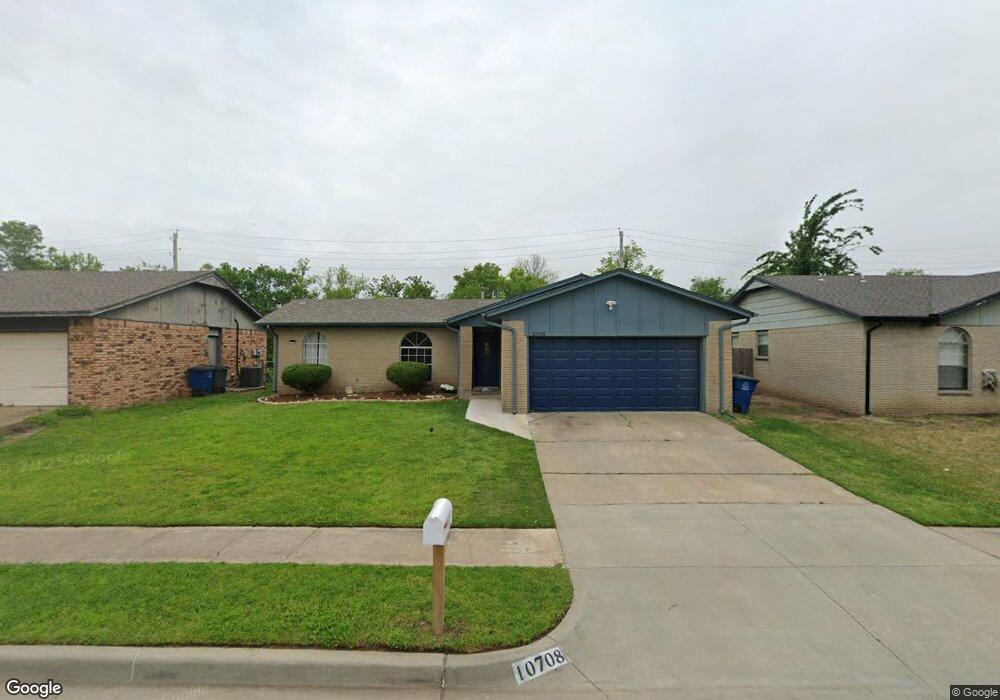
10708 E 38th St Tulsa, OK 74146
Milwood NeighborhoodEstimated Value: $163,000 - $190,520
3
Beds
2
Baths
1,143
Sq Ft
$157/Sq Ft
Est. Value
About This Home
This home is located at 10708 E 38th St, Tulsa, OK 74146 and is currently estimated at $179,880, approximately $157 per square foot. 10708 E 38th St is a home located in Tulsa County with nearby schools including Rosa Parks Elementary School, Union 8th Grade Center, and Union 6th-7th Grade Center.
Ownership History
Date
Name
Owned For
Owner Type
Purchase Details
Closed on
Aug 27, 2024
Sold by
Ebady-Nezami Shahriyar and Ebady-Nezami Valerie Jean
Bought by
Duran Daisy E and Murillo David Duran
Current Estimated Value
Home Financials for this Owner
Home Financials are based on the most recent Mortgage that was taken out on this home.
Original Mortgage
$153,000
Outstanding Balance
$150,952
Interest Rate
6.77%
Mortgage Type
New Conventional
Estimated Equity
$28,928
Purchase Details
Closed on
Jul 24, 2015
Sold by
King & King Acquisitions Inc
Bought by
Ebady Nezami Shahriyer and Ebady Nezami Valerie Jean
Purchase Details
Closed on
Jul 22, 2015
Sold by
Vasquez Carlos Alberto and Villalobosde Vasquez Celsa B
Bought by
King Acquisitions Inc
Purchase Details
Closed on
Feb 28, 2007
Sold by
Medeck Chrissy Lynn and Medeck Shawn
Bought by
Vasquez Carlos Alberto
Purchase Details
Closed on
Apr 1, 1984
Create a Home Valuation Report for This Property
The Home Valuation Report is an in-depth analysis detailing your home's value as well as a comparison with similar homes in the area
Home Values in the Area
Average Home Value in this Area
Purchase History
| Date | Buyer | Sale Price | Title Company |
|---|---|---|---|
| Duran Daisy E | $170,000 | None Listed On Document | |
| Ebady Nezami Shahriyer | $59,000 | Apex Title & Closing Svcs Ll | |
| King Acquisitions Inc | $47,000 | Apex Title & Closing Svcs Ll | |
| Vasquez Carlos Alberto | $74,500 | None Available | |
| -- | $45,000 | -- |
Source: Public Records
Mortgage History
| Date | Status | Borrower | Loan Amount |
|---|---|---|---|
| Open | Duran Daisy E | $153,000 |
Source: Public Records
Tax History
| Year | Tax Paid | Tax Assessment Tax Assessment Total Assessment is a certain percentage of the fair market value that is determined by local assessors to be the total taxable value of land and additions on the property. | Land | Improvement |
|---|---|---|---|---|
| 2025 | $2,712 | $19,833 | $2,723 | $17,110 |
| 2024 | $1,296 | $10,641 | $1,976 | $8,665 |
| 2023 | $1,296 | $10,135 | $1,848 | $8,287 |
| 2022 | $1,286 | $9,652 | $2,486 | $7,166 |
| 2021 | $1,240 | $9,192 | $2,368 | $6,824 |
| 2020 | $1,173 | $8,819 | $2,368 | $6,451 |
| 2019 | $1,214 | $8,819 | $2,368 | $6,451 |
| 2018 | $1,158 | $8,432 | $2,264 | $6,168 |
| 2017 | $1,109 | $8,030 | $2,156 | $5,874 |
| 2016 | $1,085 | $8,030 | $2,156 | $5,874 |
| 2015 | $1,119 | $8,195 | $2,156 | $6,039 |
| 2014 | $1,102 | $8,195 | $2,156 | $6,039 |
Source: Public Records
Map
Nearby Homes
- 10932 E 37th St
- 11502 E 37th St
- 10884 E 33rd Ct
- 3430 S 116th East Place
- 3431 S 116th East Place
- 3607 S 118th East Ave
- 3852 S 98th East Ave
- 3866 S 98th East Ave
- 11644 E 34th St
- 9456 E 39th St
- 4030 S 118th East Ave
- 3705 S 96th East Ave
- 9522 E 36th St
- 9751 E 31st St
- 3118 S 115th East Ave
- 3146 S 101st East Ave Unit 1201
- 9412 E 40th Place
- 4008 S 94th East Ave
- 3347 S 120th East Place
- 3100 S 101st East Ave
- 10712 E 38th St
- 10702 E 38th St
- 10718 E 38th St
- 10636 E 38th St
- 3673 S 107th East Ave
- 3674 S 108th East Ave
- 10802 E 38th St
- 10632 E 38th St
- 3667 S 107th East Ave
- 3674 S 107th East Ave
- 3668 S 108th East Ave
- 10808 E 38th St
- 10628 E 38th St
- 3668 S 107th East Ave
- 3663 S 107th East Ave
- 3664 S 108th East Ave
- 10812 E 38th St
- 10624 E 38th St
- 3673 S 106th East Place
Your Personal Tour Guide
Ask me questions while you tour the home.