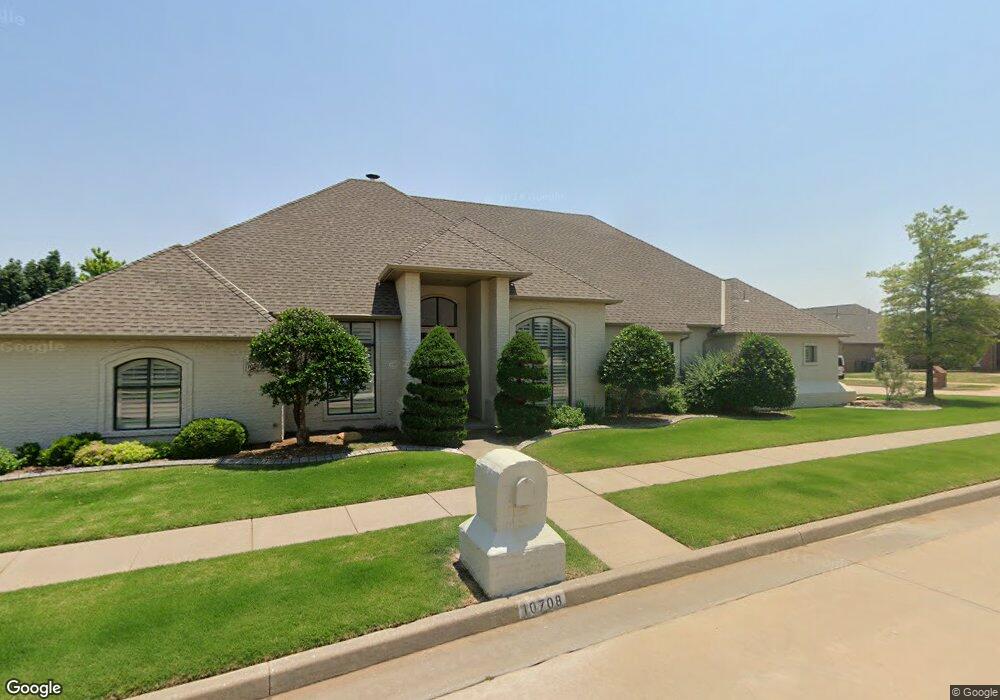
10708 State Ave Oklahoma City, OK 73162
Whitehall NeighborhoodEstimated Value: $359,201 - $402,000
3
Beds
3
Baths
2,618
Sq Ft
$145/Sq Ft
Est. Value
About This Home
This home is located at 10708 State Ave, Oklahoma City, OK 73162 and is currently estimated at $378,800, approximately $144 per square foot. 10708 State Ave is a home located in Oklahoma County with nearby schools including Wiley Post Elementary School, Hefner Middle School, and Putnam City North High School.
Ownership History
Date
Name
Owned For
Owner Type
Purchase Details
Closed on
Mar 6, 2017
Sold by
Rippetoe David and Rippetoe Sharon L
Bought by
Rippetoe David W and Rippetoe Sharon L
Current Estimated Value
Purchase Details
Closed on
Nov 14, 2012
Sold by
Shelby Becky L and Shelby Edward W
Bought by
Rippetoe David and Rippetoe Sharon L
Home Financials for this Owner
Home Financials are based on the most recent Mortgage that was taken out on this home.
Original Mortgage
$200,000
Outstanding Balance
$35,543
Interest Rate
3.4%
Mortgage Type
New Conventional
Estimated Equity
$343,257
Purchase Details
Closed on
Oct 13, 2006
Sold by
Shelby Becky L and Shelby Edward
Bought by
Shelby Becky L
Purchase Details
Closed on
Nov 1, 2003
Sold by
Kresyman Billy J and Kresyman Bertha J
Bought by
Shelby Becky L
Purchase Details
Closed on
Apr 3, 2002
Sold by
Rick Russell Homes Inc
Bought by
Shelby Edward
Create a Home Valuation Report for This Property
The Home Valuation Report is an in-depth analysis detailing your home's value as well as a comparison with similar homes in the area
Home Values in the Area
Average Home Value in this Area
Purchase History
| Date | Buyer | Sale Price | Title Company |
|---|---|---|---|
| Rippetoe David W | -- | None Available | |
| Rippetoe David | $250,000 | Capitol Abstract & Title Co | |
| Shelby Becky L | -- | None Available | |
| Shelby Becky L | -- | Capitol Abstract & Title Co | |
| Shelby Edward | $263,500 | Capitol & Title Abstract |
Source: Public Records
Mortgage History
| Date | Status | Borrower | Loan Amount |
|---|---|---|---|
| Open | Rippetoe David | $200,000 |
Source: Public Records
Tax History Compared to Growth
Tax History
| Year | Tax Paid | Tax Assessment Tax Assessment Total Assessment is a certain percentage of the fair market value that is determined by local assessors to be the total taxable value of land and additions on the property. | Land | Improvement |
|---|---|---|---|---|
| 2024 | $3,578 | $31,260 | $5,112 | $26,148 |
| 2023 | $3,578 | $30,349 | $5,263 | $25,086 |
| 2022 | $3,513 | $29,466 | $4,736 | $24,730 |
| 2021 | $3,375 | $28,608 | $5,551 | $23,057 |
| 2020 | $3,258 | $27,775 | $5,613 | $22,162 |
| 2019 | $3,316 | $28,664 | $5,488 | $23,176 |
| 2018 | $3,220 | $27,830 | $0 | $0 |
| 2017 | $3,339 | $28,764 | $6,030 | $22,734 |
| 2016 | $3,293 | $28,431 | $5,826 | $22,605 |
| 2015 | $3,231 | $27,604 | $6,030 | $21,574 |
| 2014 | $3,108 | $27,604 | $5,836 | $21,768 |
Source: Public Records
Map
Nearby Homes
- 5417 NW 106th St
- 5513 NW 106th St
- 5524 NW 107th St
- 10404 Regent St
- 5508 NW 108th Terrace
- 5616 NW 109th St
- 10408 Bishops Gate
- 5652 NW 103rd St
- 10716 Eastlake Cir
- 6005 W Hefner Rd
- 11201 Blue Stem Dr
- 11113 Blue Stem Dr
- 5613 NW 115th St
- 9816 Hefner Village Blvd
- 6316 W Hefner Rd
- 11413 Spring Creek Rd
- 9775 Hefner Village Blvd
- 10840 Admiral Dr
- 9719 Hefner Village Blvd
- 5204 NW 118th Cir
- 5409 NW 107th Terrace
- 10712 State Ave
- 10705 State Ave
- 10709 N Ann Arbor Ave
- 10713 N Ann Arbor Ave
- 10709 State Ave
- 5412 NW 107th Terrace
- 5416 NW 107th Terrace
- 10716 State Ave
- 10717 N Ann Arbor Ave
- 10713 State Ave
- 5420 NW 107th Terrace
- 10720 State Ave
- 10721 Ann Arbor Ave
- 5421 NW 106th St
- 10717 State Ave
- 5413 NW 106th St
- 10704 N Ann Arbor Ave
- 10708 N Ann Arbor Ave
- 10709 Whitehall Blvd